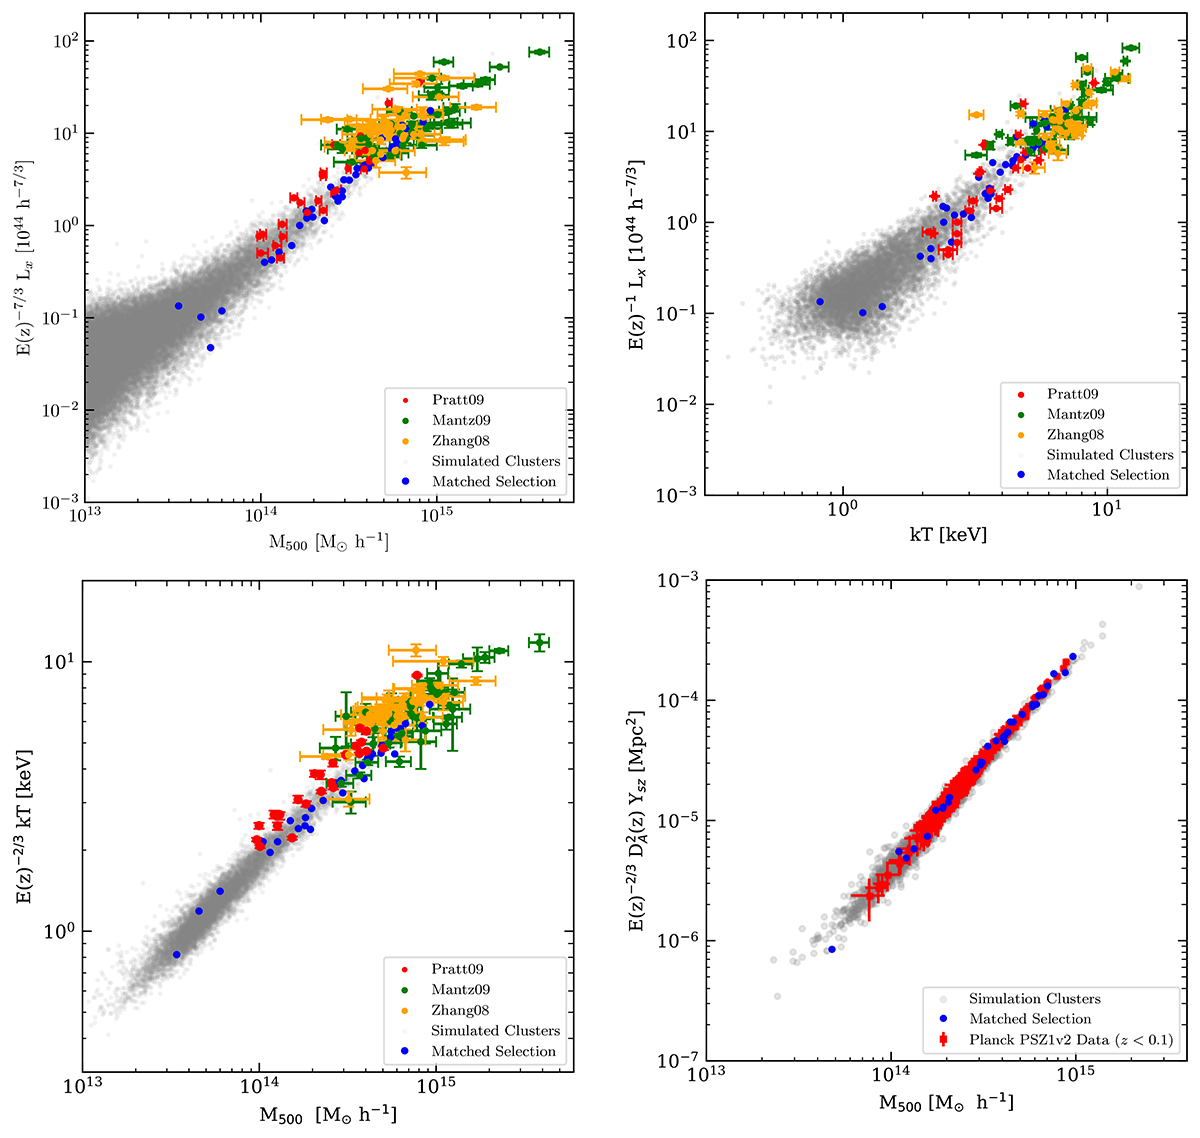
Fig. 2.
Download original image
Scaling relations within R500 for simulated clusters at z = 0 and for observed low redshift clusters. Gray data points represent the cluster values from our simulations, estimated using SUBFIND (Springel et al. 2001; Dolag et al. 2009; Saro et al. 2006). The clusters that have been cross-identified are highlighted in blue. Luminosity-mass (Lx – M500, top left), luminosity-temperature (Lx – kT, top right), temperature-mass (kT – M500, bottom left) panels show observational data from Pratt et al. (2009) (depicted as red points), which encompasses clusters with redshifts ranging from 0.05 to 0.164, Zhang et al. (2008) (depicted in yellow) with clusters spanning the redshift range of 0.14 to 0.3, and Mantz et al. (2010a) (depicted in green), which includes clusters with redshifts less than 0.3. The bottom right panel depicts the Compton-y – M500 scaling relation. For observational data in this case, we rely on Planck’s catalog PSZ1v2 (Planck Collaboration XXIX 2014), considering only clusters with a redshift of less than 0.1.
Current usage metrics show cumulative count of Article Views (full-text article views including HTML views, PDF and ePub downloads, according to the available data) and Abstracts Views on Vision4Press platform.
Data correspond to usage on the plateform after 2015. The current usage metrics is available 48-96 hours after online publication and is updated daily on week days.
Initial download of the metrics may take a while.