Fig. 1.
Download original image
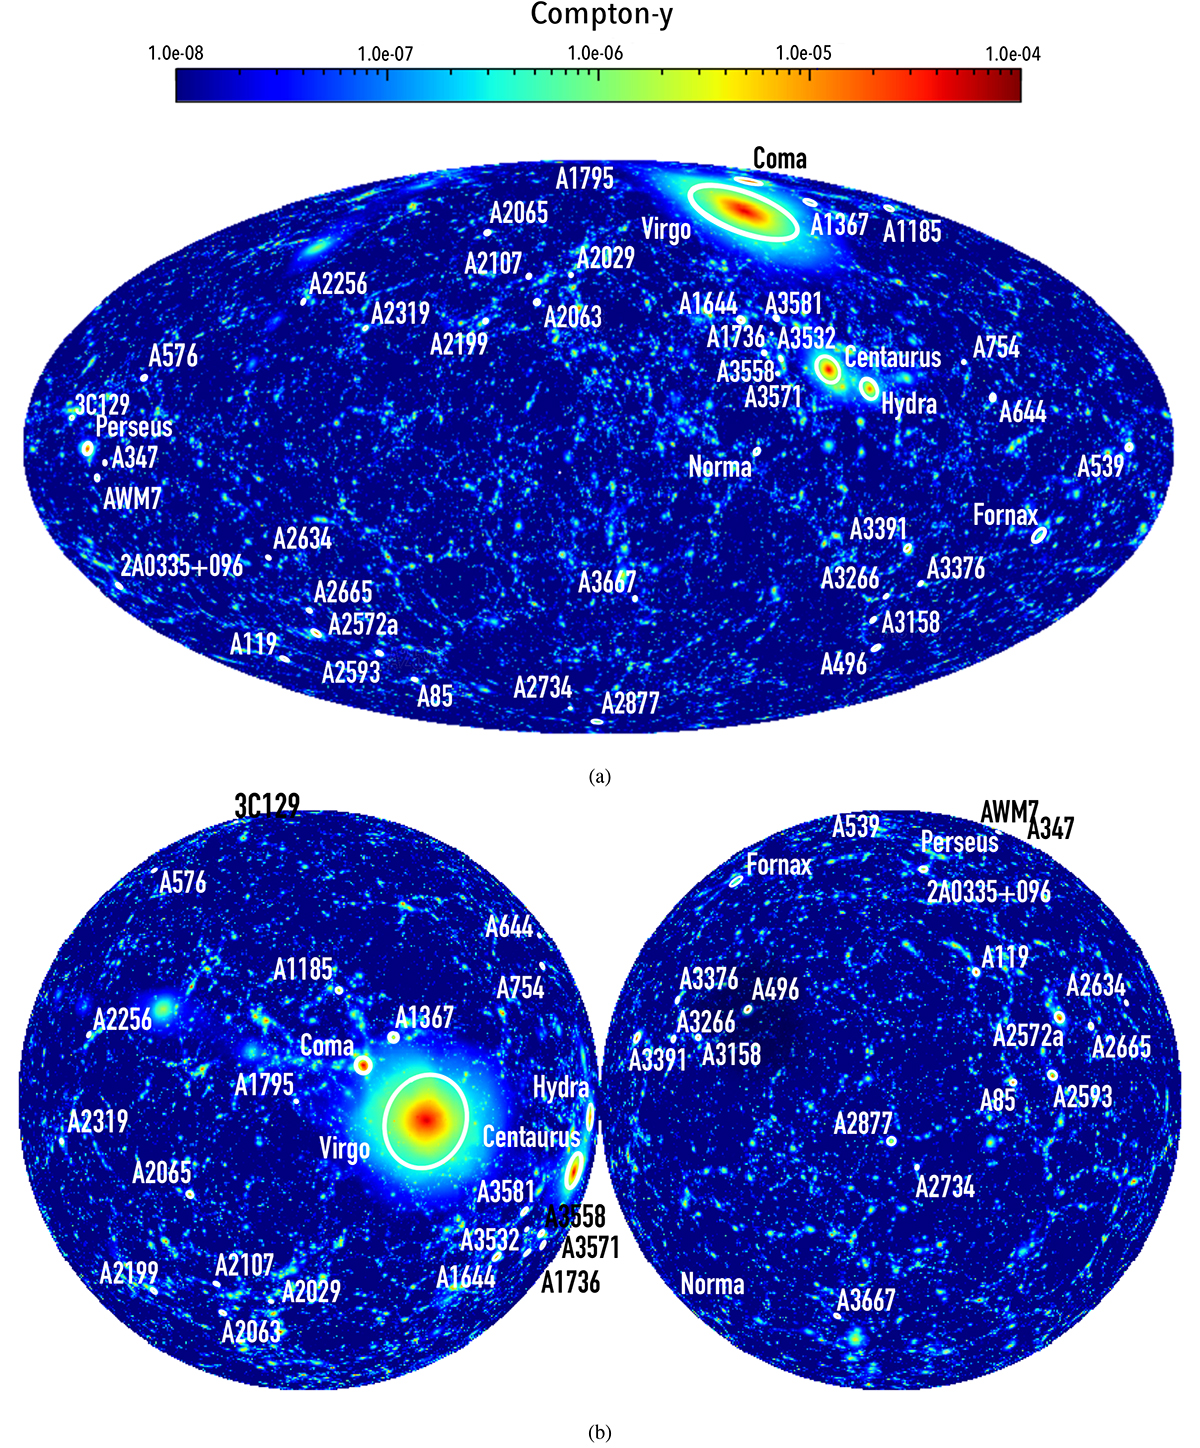
Full-sky projections of the Compton-y signal encompassing the entire simulation volume in SLOW are shown in the following manner: (a) A full-sky projection in galactic coordinates. (b) On the left, the galactic northern sky is projected, while on the right, the galactic southern sky is shown. The zone of avoidance lies at the edge of the spheres. Circles are employed to mark the projected r500 values for the cross-identified clusters. Note that the cross-identification of A576 and A3571 was improved with respect to Dolag et al. (2023).
Current usage metrics show cumulative count of Article Views (full-text article views including HTML views, PDF and ePub downloads, according to the available data) and Abstracts Views on Vision4Press platform.
Data correspond to usage on the plateform after 2015. The current usage metrics is available 48-96 hours after online publication and is updated daily on week days.
Initial download of the metrics may take a while.