Fig. E.3
Download original image
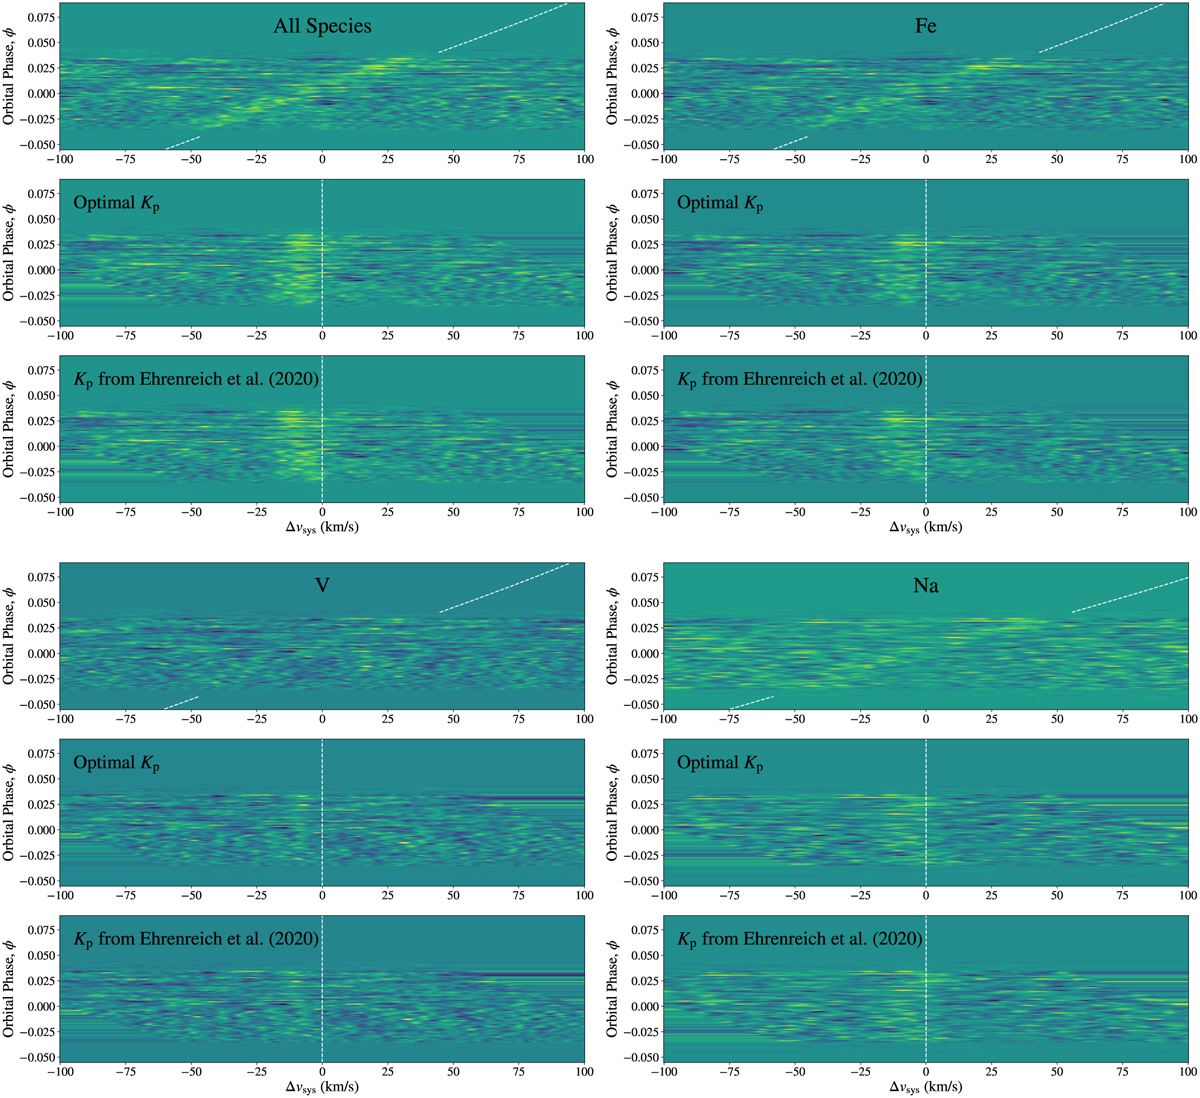
CC trails of various species for T3, shifted to the optimum Kp values, as well as to the Kp value from Ehrenreich et al. (2020), in order to visualise any apparent kink. The atmospheric models were calculated using the optimum parameters from our various atmospheric retrievals but were un-broadened so that any deviation from the planet’s Keplerian velocity curve are visible. For clarity, we only plot species in which there was a clearly visible CC trail.
Current usage metrics show cumulative count of Article Views (full-text article views including HTML views, PDF and ePub downloads, according to the available data) and Abstracts Views on Vision4Press platform.
Data correspond to usage on the plateform after 2015. The current usage metrics is available 48-96 hours after online publication and is updated daily on week days.
Initial download of the metrics may take a while.