Fig. D.3
Download original image
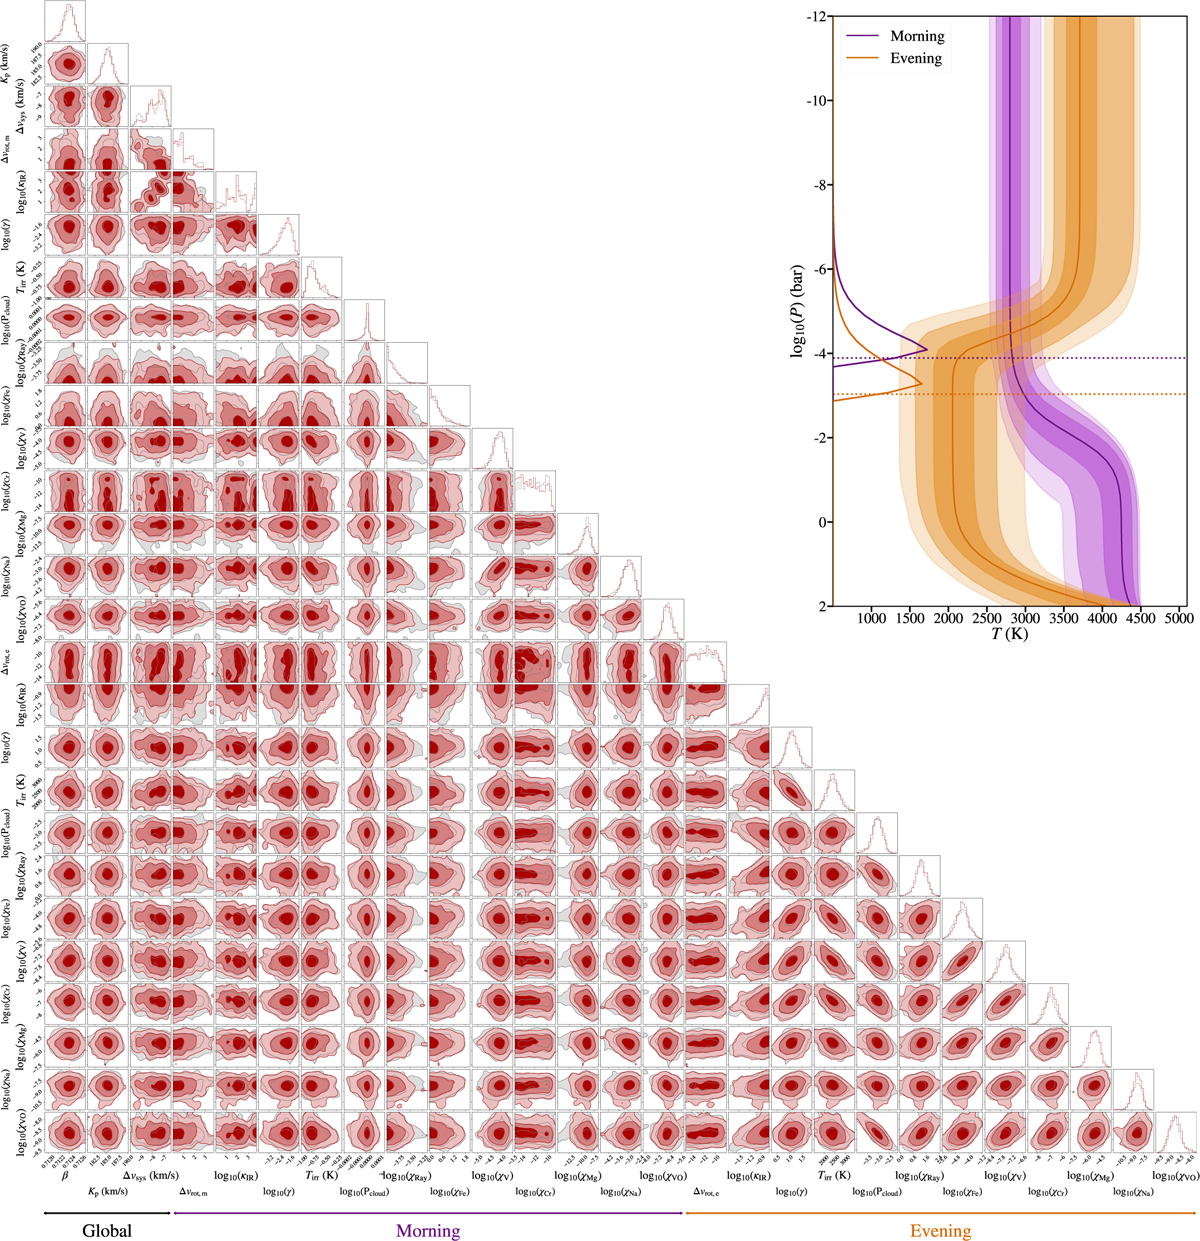
Summary of our atmospheric retrieval results for T1 outlined in Sect. 3.4, with the 1D and 2D marginalised posterior distributions of each of our model parameters displayed. The red and grey posterior distributions represent independent sub-chains, of the same MCMC chain, both converging to similar distributions. The various global, morning, and evening parameters are highlighted. The T-P profiles on the right were computed from 10,000 random samples of the MCMC; the solid curve shows the median profile, and the shaded regions show the 1σ, 2σ, and 3σ contours, for both the morning and evening limbs. The horizontal dotted lines are the median retrieved cloud deck pressures, log10(Pcloud), below which the model spectrum is truncated. Also plotted are the mean contribution functions for the ESPRESSO wavelength range. This corner diagram was generated using CORNER (Foreman-Mackey 2016).
Current usage metrics show cumulative count of Article Views (full-text article views including HTML views, PDF and ePub downloads, according to the available data) and Abstracts Views on Vision4Press platform.
Data correspond to usage on the plateform after 2015. The current usage metrics is available 48-96 hours after online publication and is updated daily on week days.
Initial download of the metrics may take a while.