Fig. 9
Download original image
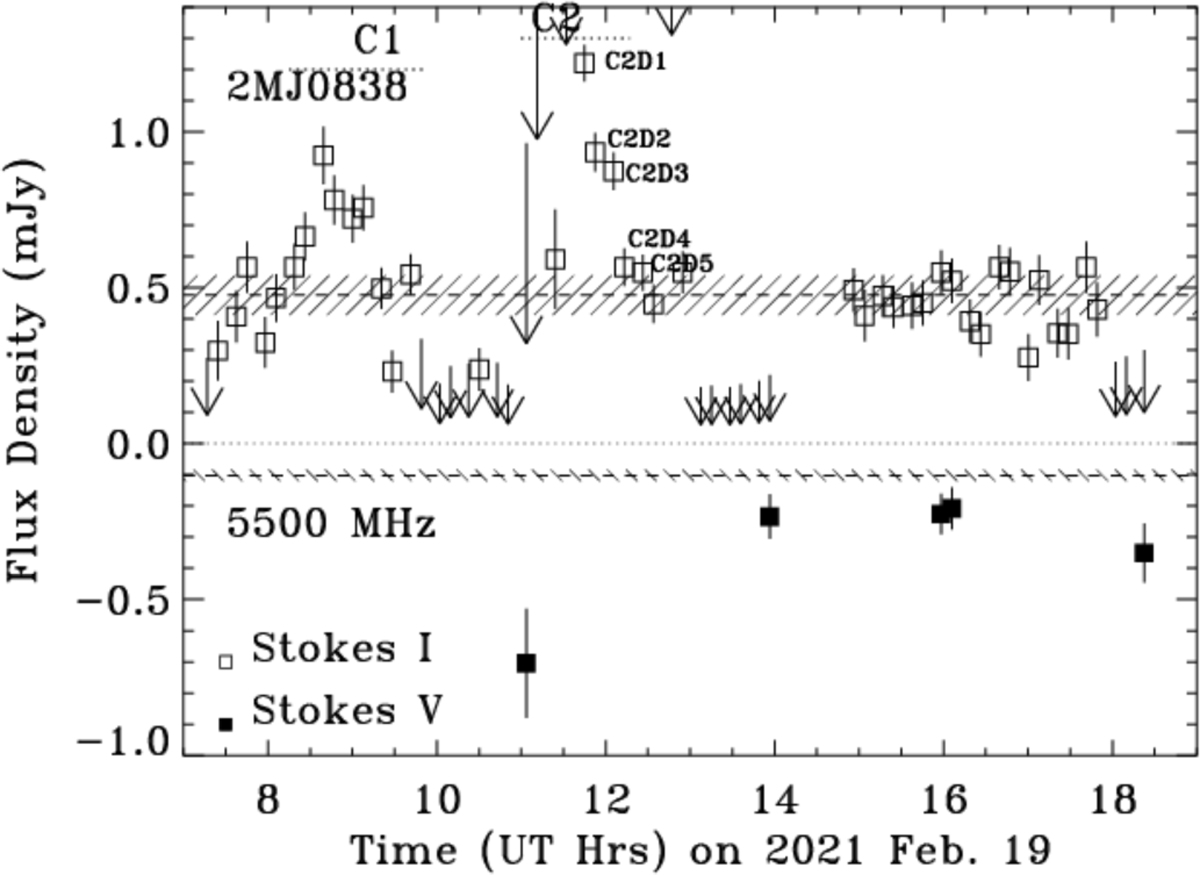
Total intensity and circular polarization behavior of 2MJ0838 with ATCA at C band. Light curve bin size is 7.5 min. Open squares indicate detections of total intensity, and filled symbols indicate detections of circularly polarized flux density. For upper limits in total intensity, an arrow from 1σ to 3σ is shown. The dashed lines and forward (backward) hatched regions indicate the average flux density and standard deviation for total intensity (circularly polarized flux) determined from image analysis spanning the entire time. Approximate extent of events “C1” and “C2” are indicated. Specific time bins in the decay phase of event C2 are denoted, and their spectral energy distributions are plotted in Fig. 11.
Current usage metrics show cumulative count of Article Views (full-text article views including HTML views, PDF and ePub downloads, according to the available data) and Abstracts Views on Vision4Press platform.
Data correspond to usage on the plateform after 2015. The current usage metrics is available 48-96 hours after online publication and is updated daily on week days.
Initial download of the metrics may take a while.