Fig. 8
Download original image
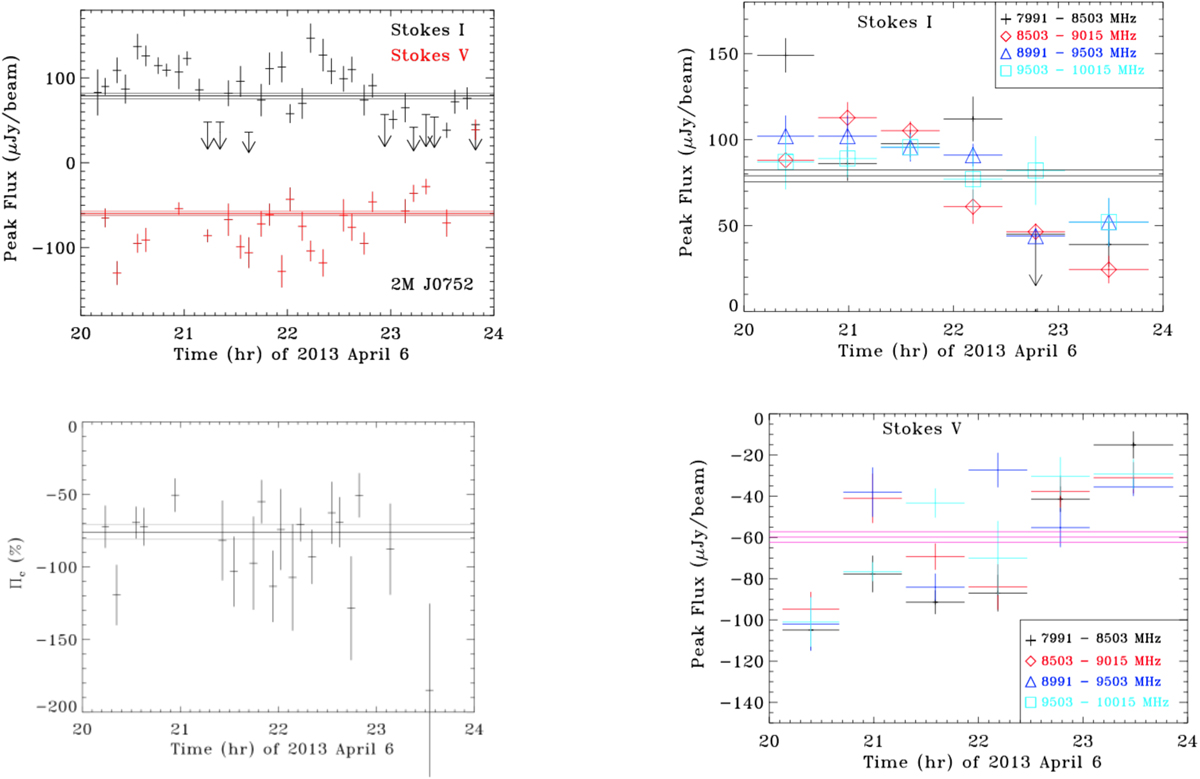
Time series of JVLA data for 2M0752. Top left: variation of total intensity and circularly polarized flux with time integrated over all frequencies. The black and the red line denote, respectively, the time-averaged total intensity and the time-averaged amount of Stokes V flux. Bottom left: variation of the percent circular polariation integrated over all frequencies and time-average value shown as black line. Top right: time and frequency variations of the Stokes I flux density, broken up into six time bins and four frequency spans. Bottom right: variations of circularly polarized flux with the same time and frequency bins as for total flux density.
Current usage metrics show cumulative count of Article Views (full-text article views including HTML views, PDF and ePub downloads, according to the available data) and Abstracts Views on Vision4Press platform.
Data correspond to usage on the plateform after 2015. The current usage metrics is available 48-96 hours after online publication and is updated daily on week days.
Initial download of the metrics may take a while.