Open Access
Fig. 4
Download original image
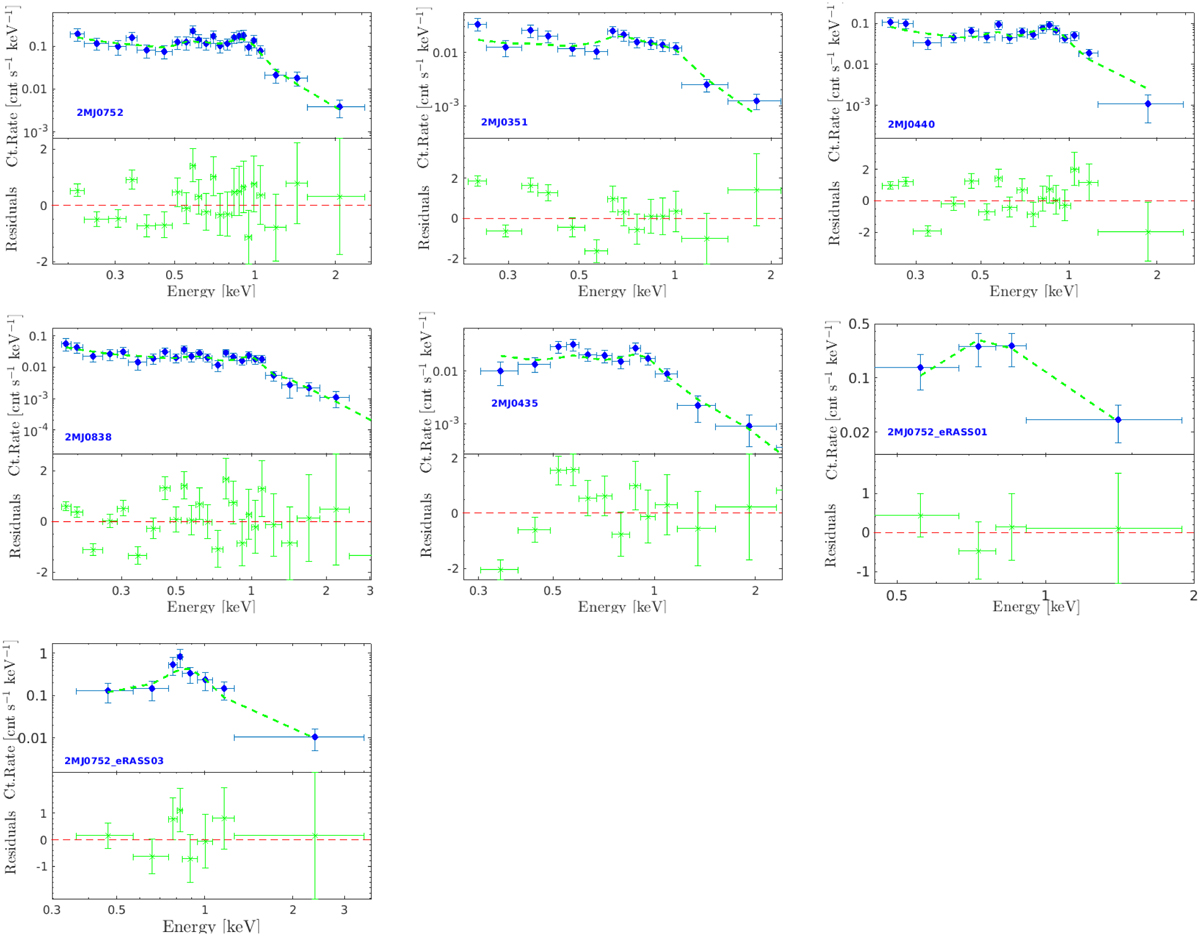
X-ray spectra of UCDs associated with XMM-Newton (the first five panels) and eROSITA (the last two panels) sources that have more than 200 and 30 net counts, respectively. The spectra are plotted together with the best-fitting apec model and the residuals (both shown in green); see text in Sect. 3.1.3 and Table 6.
Current usage metrics show cumulative count of Article Views (full-text article views including HTML views, PDF and ePub downloads, according to the available data) and Abstracts Views on Vision4Press platform.
Data correspond to usage on the plateform after 2015. The current usage metrics is available 48-96 hours after online publication and is updated daily on week days.
Initial download of the metrics may take a while.