Open Access
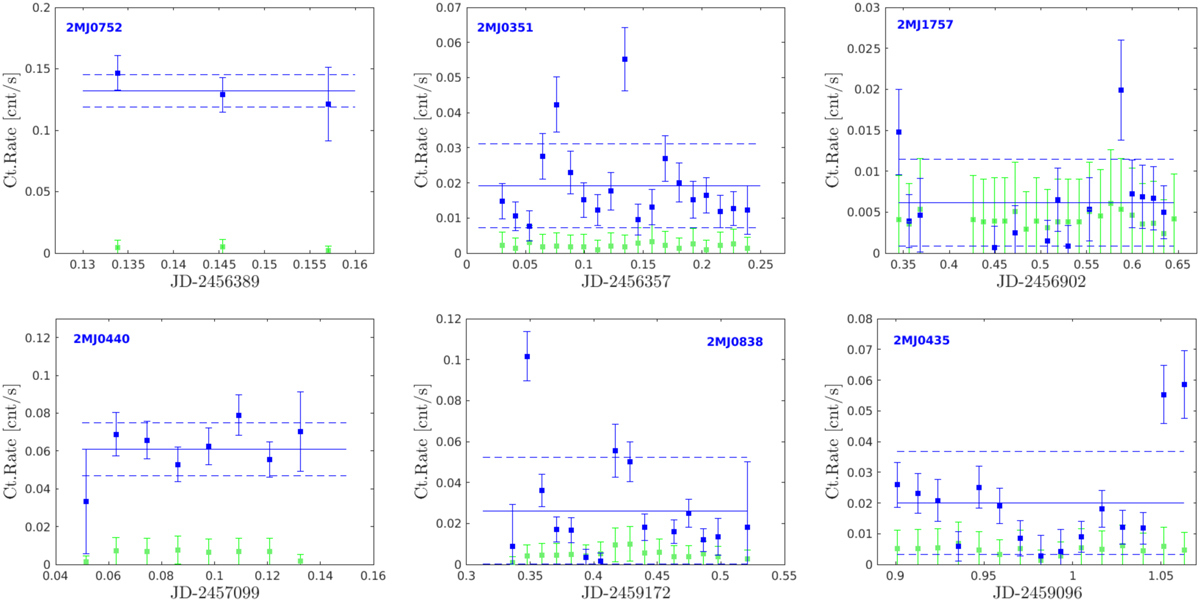
Fig. 2
Download original image
Background-subtracted XMM-Newton EPIC/pn light curves in the energy band of 0.2–2.0 keV of the detected UCDs (blue) and the light curves of the background (green) both with a 1 ks bin size. The mean count rate and its standard deviation are shown as horizontal solid and dashed bars.
Current usage metrics show cumulative count of Article Views (full-text article views including HTML views, PDF and ePub downloads, according to the available data) and Abstracts Views on Vision4Press platform.
Data correspond to usage on the plateform after 2015. The current usage metrics is available 48-96 hours after online publication and is updated daily on week days.
Initial download of the metrics may take a while.