Fig. 15
Download original image
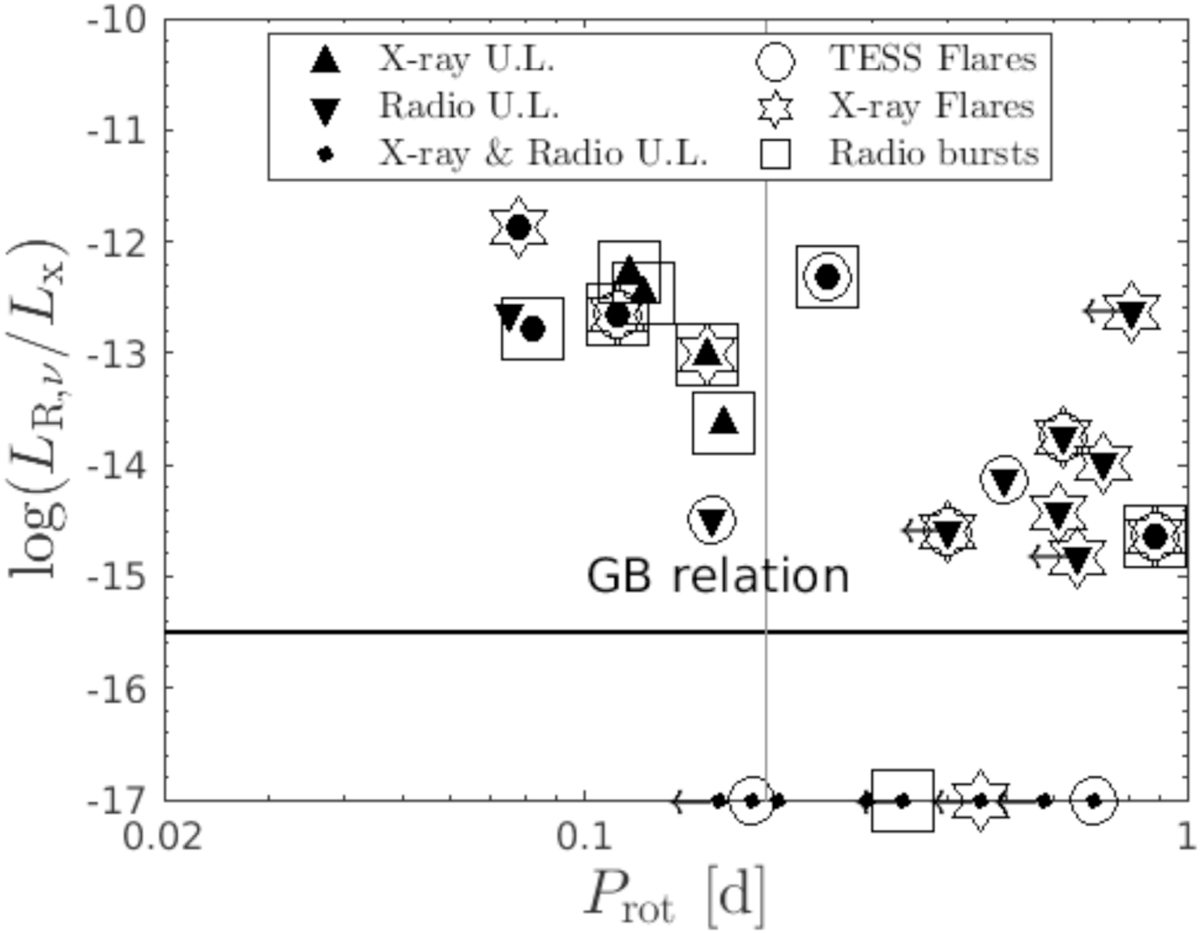
Radio to X-ray luminosity ratio vs. the rotation period. TESS and X-ray flares are shown with open filled circles and stars, respectively, while radio bursts with open filled squares. UCDs that are placed on the x-axis are undetected with both X-ray and radio instruments. The solid horizontal line at log(LR,v/Lx) 15.5 represents the relation of Güdel & Benz (1993) as a function of Prot, while the vertical line at Prot = 0.2 day is from Pineda et al. (2017) to separate the radio-loud from the radio-quiet regime.
Current usage metrics show cumulative count of Article Views (full-text article views including HTML views, PDF and ePub downloads, according to the available data) and Abstracts Views on Vision4Press platform.
Data correspond to usage on the plateform after 2015. The current usage metrics is available 48-96 hours after online publication and is updated daily on week days.
Initial download of the metrics may take a while.