Open Access
Fig. 13
Download original image
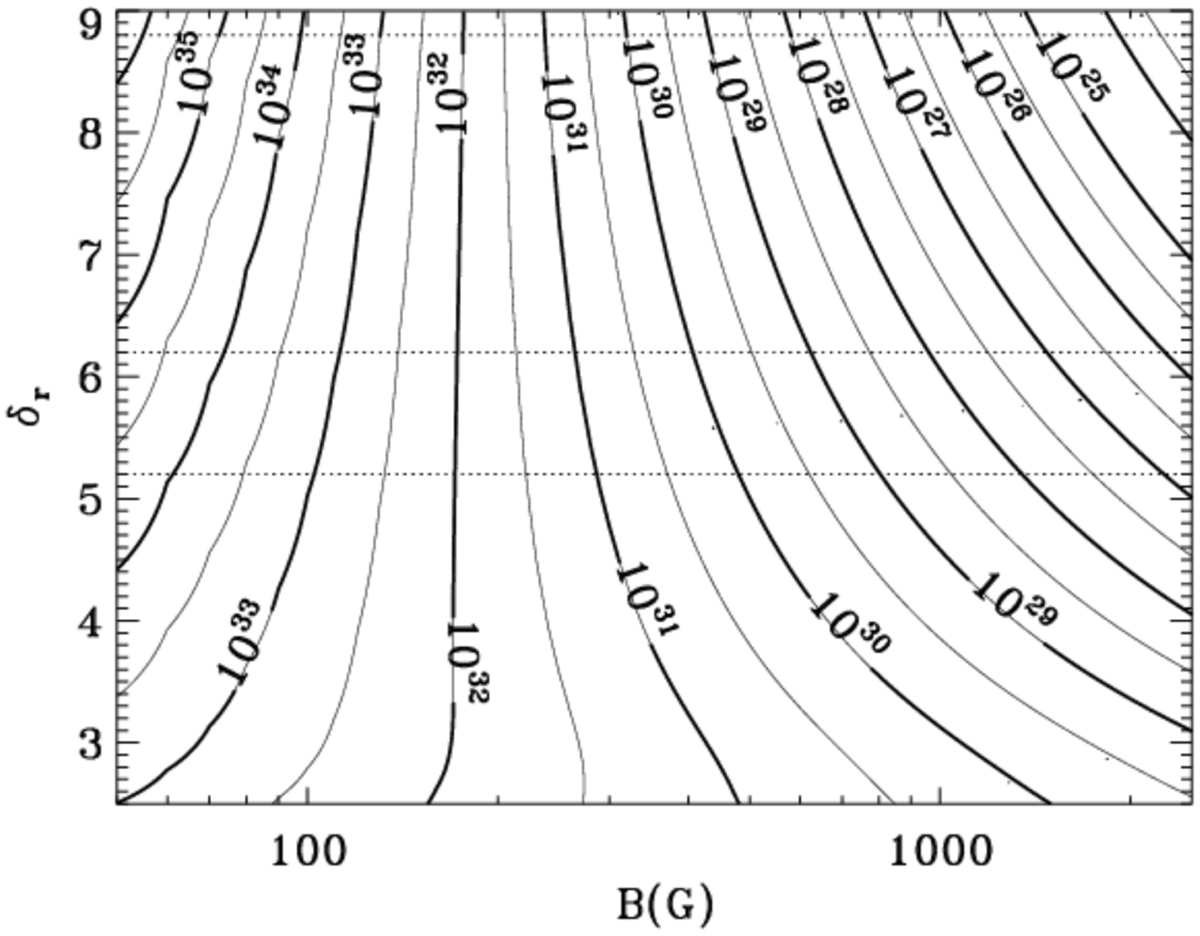
Contour plot of estimated nonthermal energy in radio flare C2 seen on SCR0838, as a function of the magnetic field strength (B) in the radio emitting region and the power-law index of the distribution of accelerated particles, δr. Horizontal lines indicate the range of δr from the frequency dependence in Fig. 11.
Current usage metrics show cumulative count of Article Views (full-text article views including HTML views, PDF and ePub downloads, according to the available data) and Abstracts Views on Vision4Press platform.
Data correspond to usage on the plateform after 2015. The current usage metrics is available 48-96 hours after online publication and is updated daily on week days.
Initial download of the metrics may take a while.