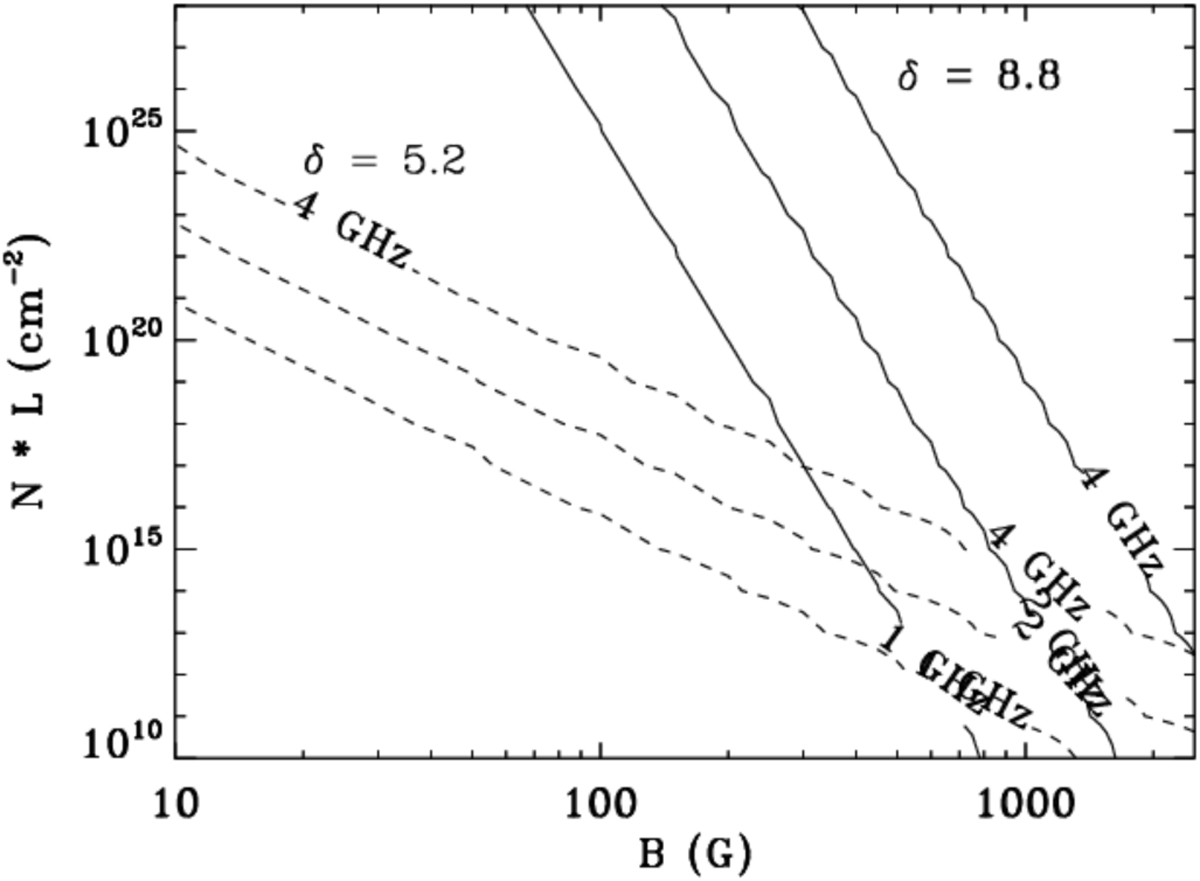
Fig. 12
Download original image
Contour plot of dependence of the peak frequency of gyrosyn-chrotron emission as a function of magnetic field strength in the radio-emitting source and the product of total number density of accelerated electrons and size scale of the emission NL. Two different sets of contours are shown, which bracket the inferred values of δr seen in the frequency-dependent decay of event C2 in SCR0838 shown in Fig. 11. The larger values of NL provide more constraints on the field strength in the radio-emitting region, in order to be consistent with the low peak frequency and the smaller value of δr.
Current usage metrics show cumulative count of Article Views (full-text article views including HTML views, PDF and ePub downloads, according to the available data) and Abstracts Views on Vision4Press platform.
Data correspond to usage on the plateform after 2015. The current usage metrics is available 48-96 hours after online publication and is updated daily on week days.
Initial download of the metrics may take a while.