Fig. 11
Download original image
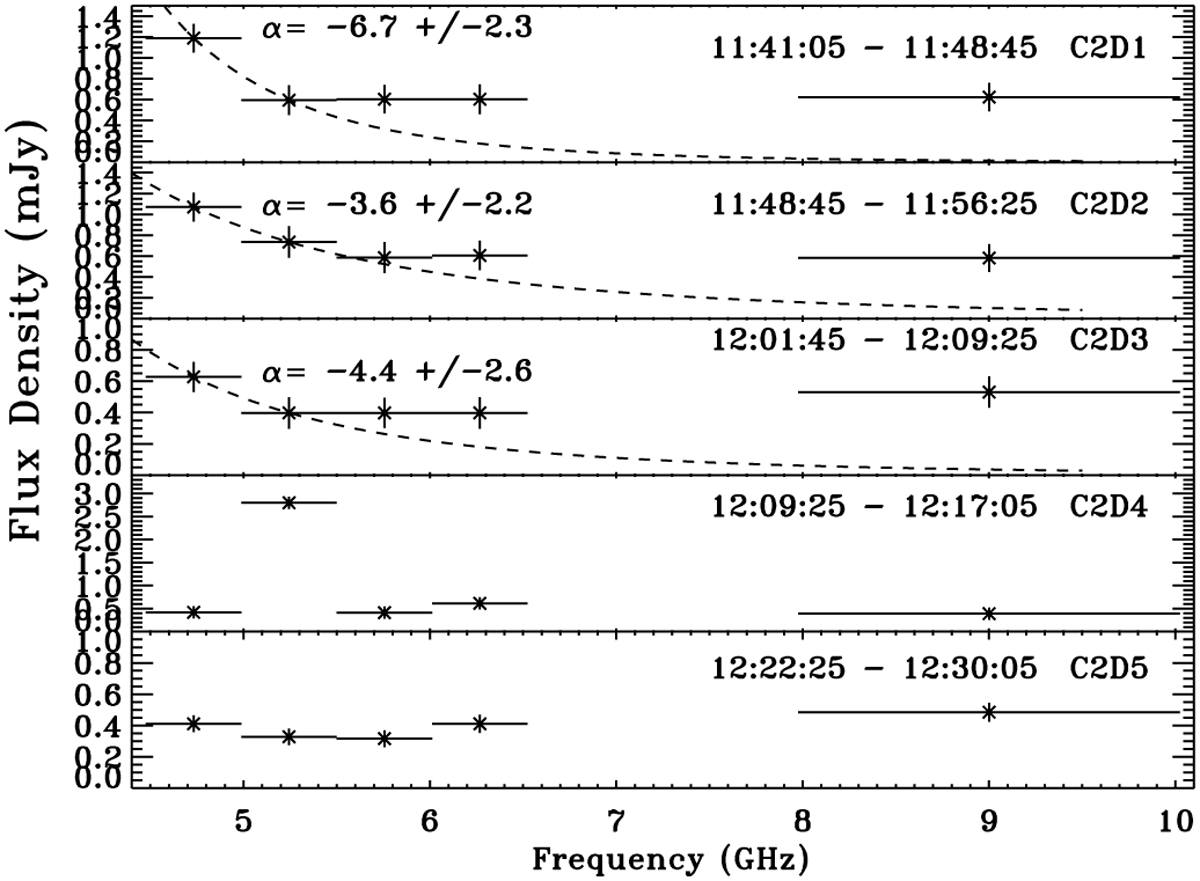
Spectra of individual time bins during the decay phase of event C2 on SCR 0838 noted in Fig. 9. The C-band was divided into four spectral bins for which the flux was computed, while the X-band is represented by a single flux measurement. The spectral index calculated from the two lowest frequency bins is shown for the first three time bins in the decay of C2.
Current usage metrics show cumulative count of Article Views (full-text article views including HTML views, PDF and ePub downloads, according to the available data) and Abstracts Views on Vision4Press platform.
Data correspond to usage on the plateform after 2015. The current usage metrics is available 48-96 hours after online publication and is updated daily on week days.
Initial download of the metrics may take a while.