Fig. 1
Download original image
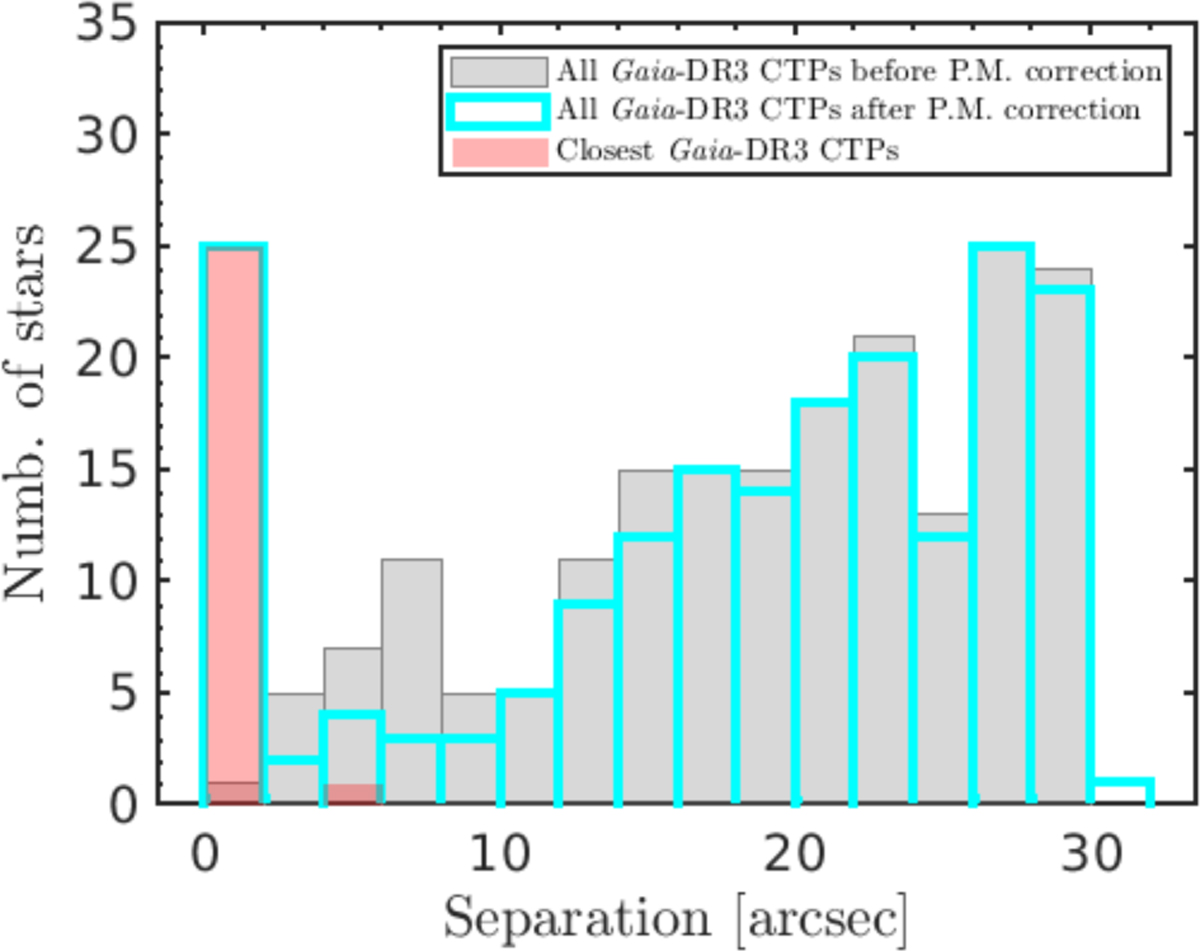
Separation between the Gaia-DR3 (J2016) and the J2000 positions for the ten UCDs from our dedicated X-ray/radio campaigns and the 16 UCDs from the literature sample. All 191 Gaia-DR3 counterparts within 30″ are shown in gray. In turquoise there are the same objects but after the application of their P.M. correction. The red histogram represents the subsample of closest Gaia-DR3 CTPs to all UCDs after the P.M. correction.
Current usage metrics show cumulative count of Article Views (full-text article views including HTML views, PDF and ePub downloads, according to the available data) and Abstracts Views on Vision4Press platform.
Data correspond to usage on the plateform after 2015. The current usage metrics is available 48-96 hours after online publication and is updated daily on week days.
Initial download of the metrics may take a while.