Fig. E.3
Download original image
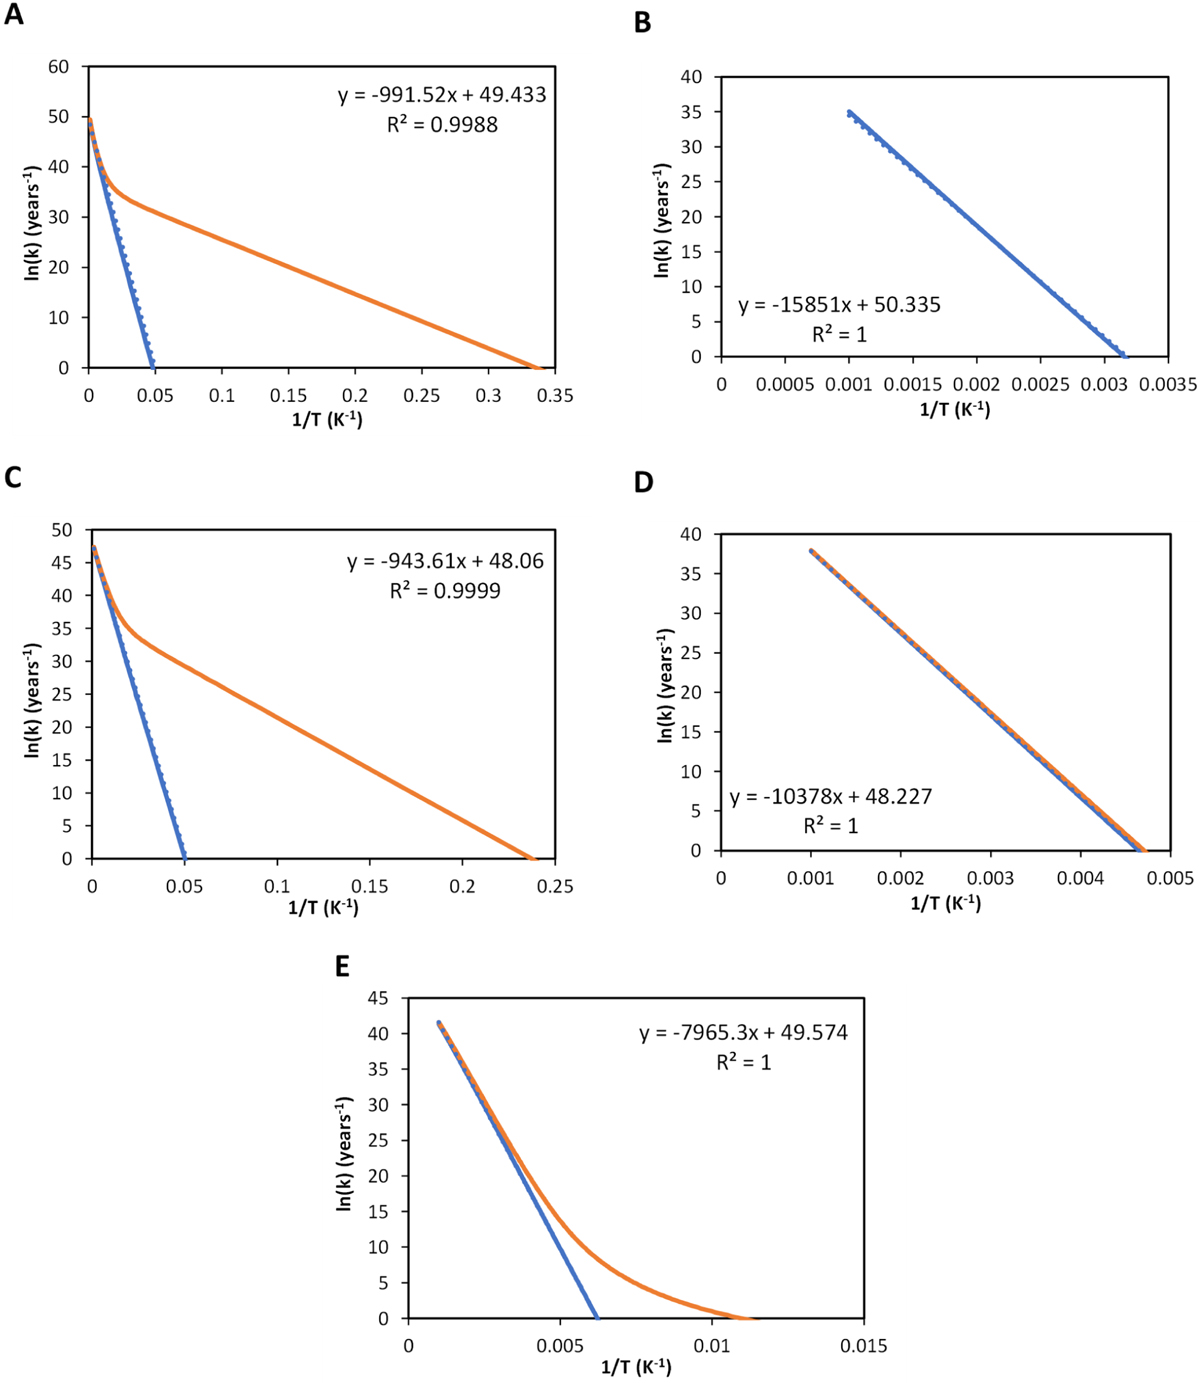
Arrhenius plot for the free energy barrier associated with TS1 (panel A), TS2 (panel B), TS3 (panel C), TS4 (panel D), and TS5 (panel E). Values of the natural logarithm of the rate constant (ln(k)) are represented in year–1 and the inverse of the temperatures (1/T) in K–1. Represented in blue are the RRKM rate constants and in orange the rate constants, considering tunneling. Also included are the fits and correlation coefficients.
Current usage metrics show cumulative count of Article Views (full-text article views including HTML views, PDF and ePub downloads, according to the available data) and Abstracts Views on Vision4Press platform.
Data correspond to usage on the plateform after 2015. The current usage metrics is available 48-96 hours after online publication and is updated daily on week days.
Initial download of the metrics may take a while.