Fig. 8.
Download original image
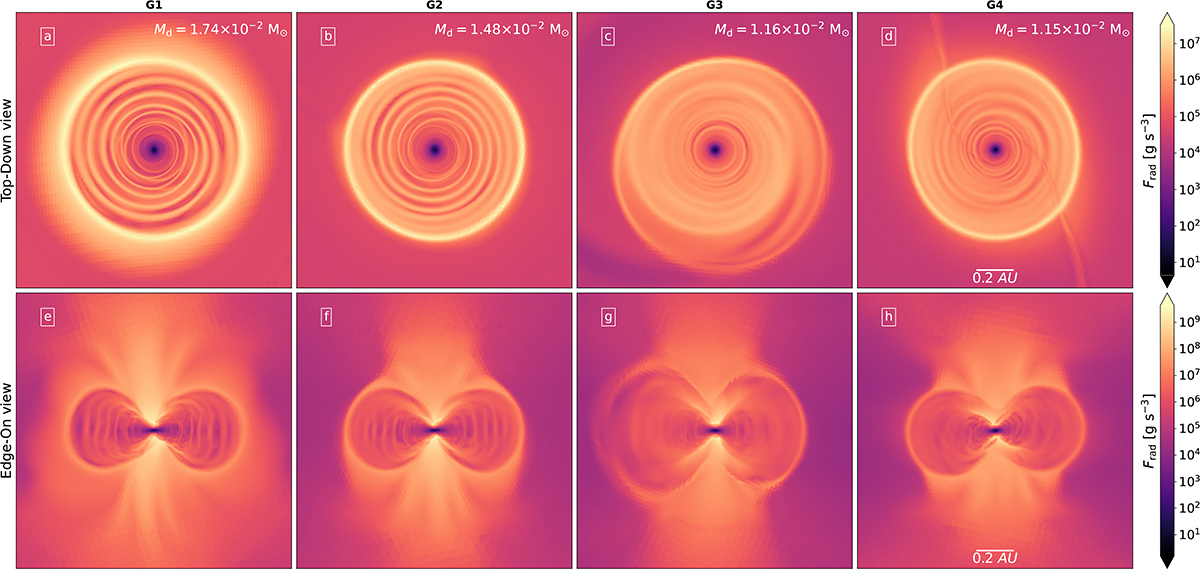
Slices through the center of the domain for runs G1, G2, G3, and G4 (respectively first, second, third, and fourth columns) showing the local radiative flux in a top-down (top row, panels a–d) and edge-on (bottom row, panels e–h) view. The slices illustrate the structure of the accretion shock as well as the presence of spirals in the inner disk (see Eq. (1)). The scale bar in panels d and h apply to all other panels as well. The slices are shown at a moment in time where the inner disks have reached a radius of ≈0.5 AU. The mass of each inner disk is displayed in the top-right corners of panels a–d.
Current usage metrics show cumulative count of Article Views (full-text article views including HTML views, PDF and ePub downloads, according to the available data) and Abstracts Views on Vision4Press platform.
Data correspond to usage on the plateform after 2015. The current usage metrics is available 48-96 hours after online publication and is updated daily on week days.
Initial download of the metrics may take a while.