Fig. 7.
Download original image
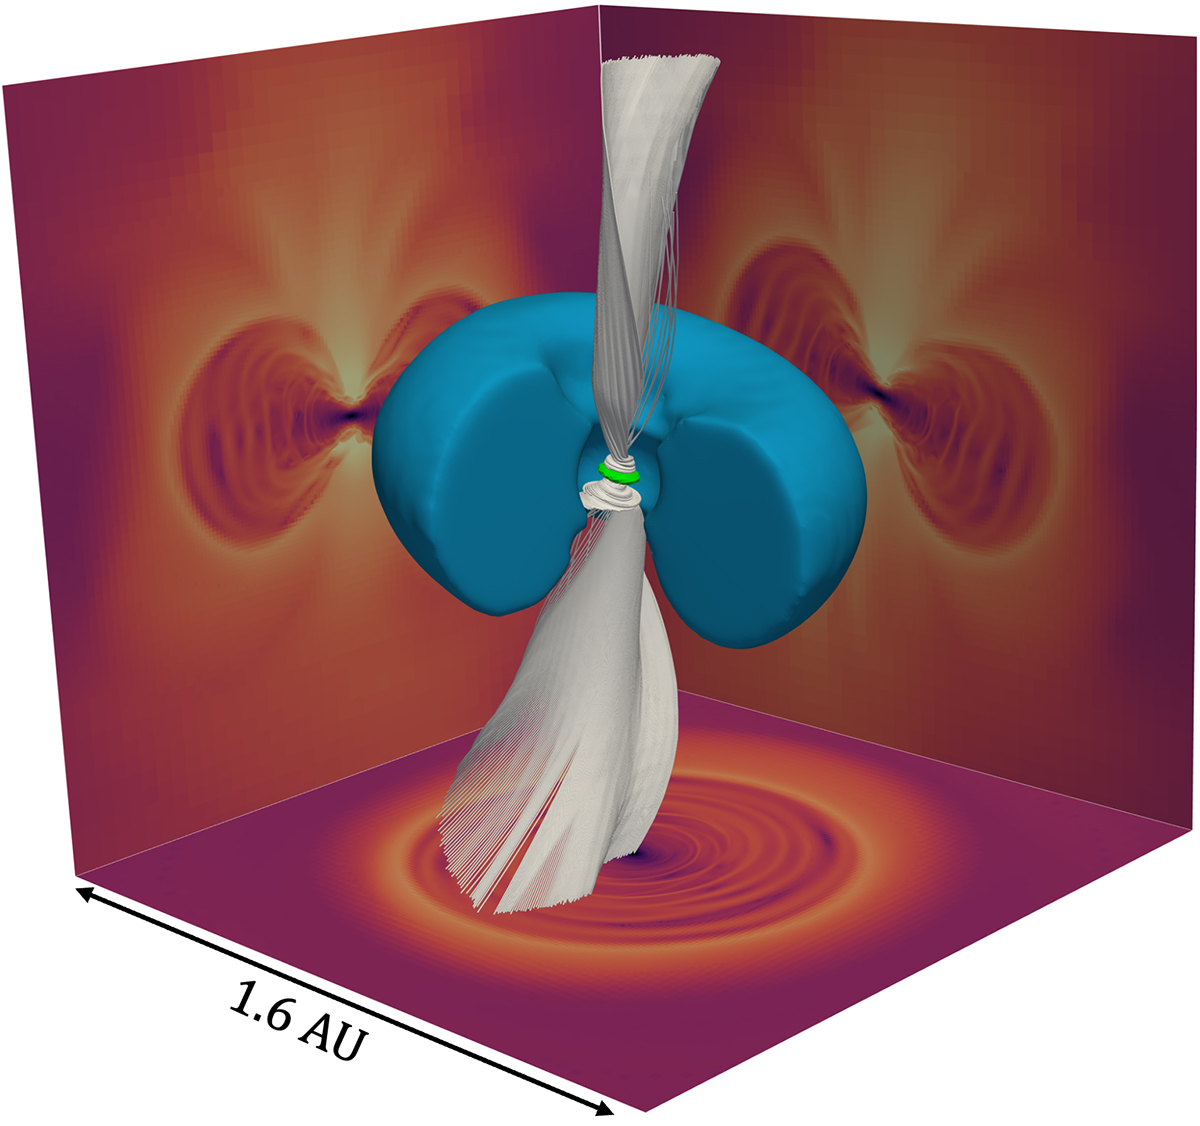
Three-dimensional view of the inner disk and protostar at a moment in time when the former has reached ≈0.5 AU in radius. The blue structure is the surface of the inner disk. The inner r < 0.1 AU region has been cut out in order to reveal the flow onto the protostar (rendered in green). The white curves are velocity vector field streamlines launched along the poles to reveal polar accretion. The bottom, left, and right panels are cross sections through the center of the domain displaying the radiative flux. The visualized volume is 1.6 × 1.6 × 1.6 AU3. An animated version of this plot is available online.
Current usage metrics show cumulative count of Article Views (full-text article views including HTML views, PDF and ePub downloads, according to the available data) and Abstracts Views on Vision4Press platform.
Data correspond to usage on the plateform after 2015. The current usage metrics is available 48-96 hours after online publication and is updated daily on week days.
Initial download of the metrics may take a while.