Fig. 6.
Download original image
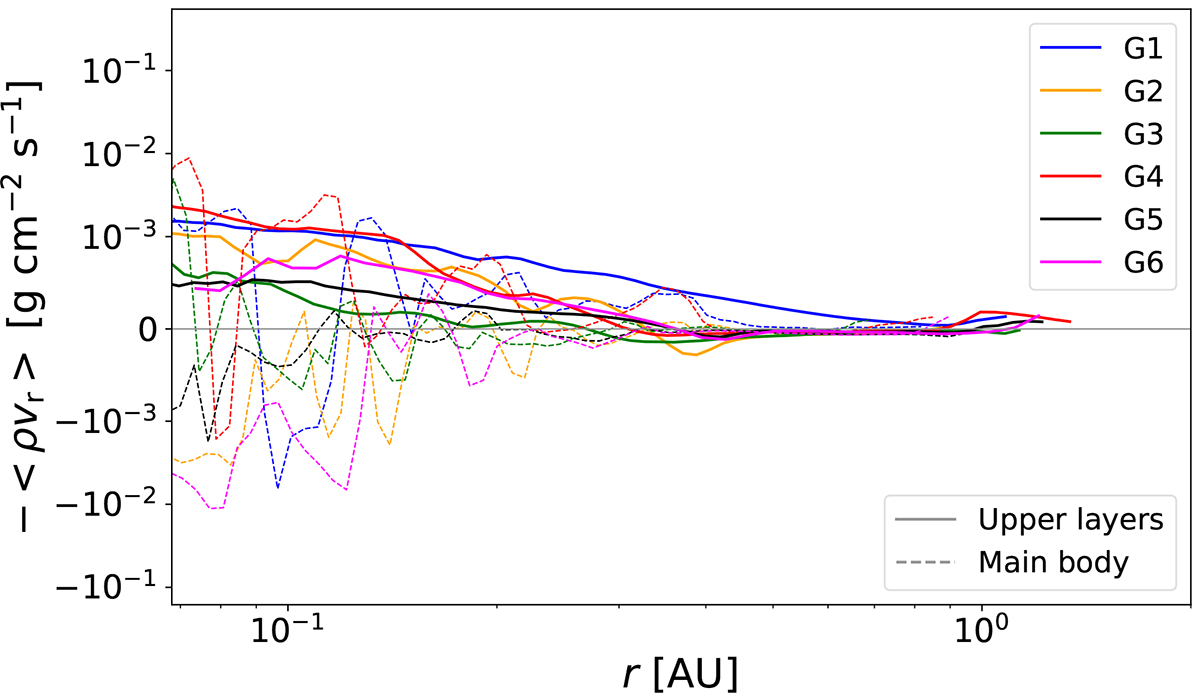
Average radial mass flux measured in radial bins for runs G1 (blue), G2 (orange), G3 (green), G4 (red), G5 (black), and G6 (magenta) at a moment in time where the inner disk has reached ≈1 AU in radius. Only cells belonging to the inner disk were considered (see Appendix A for information on how the inner disk was defined). The solid lines represent measurements made on the upper layers of the disk, whereas the dashed lines represent measurements made in its main body.
Current usage metrics show cumulative count of Article Views (full-text article views including HTML views, PDF and ePub downloads, according to the available data) and Abstracts Views on Vision4Press platform.
Data correspond to usage on the plateform after 2015. The current usage metrics is available 48-96 hours after online publication and is updated daily on week days.
Initial download of the metrics may take a while.