Fig. 15.
Download original image
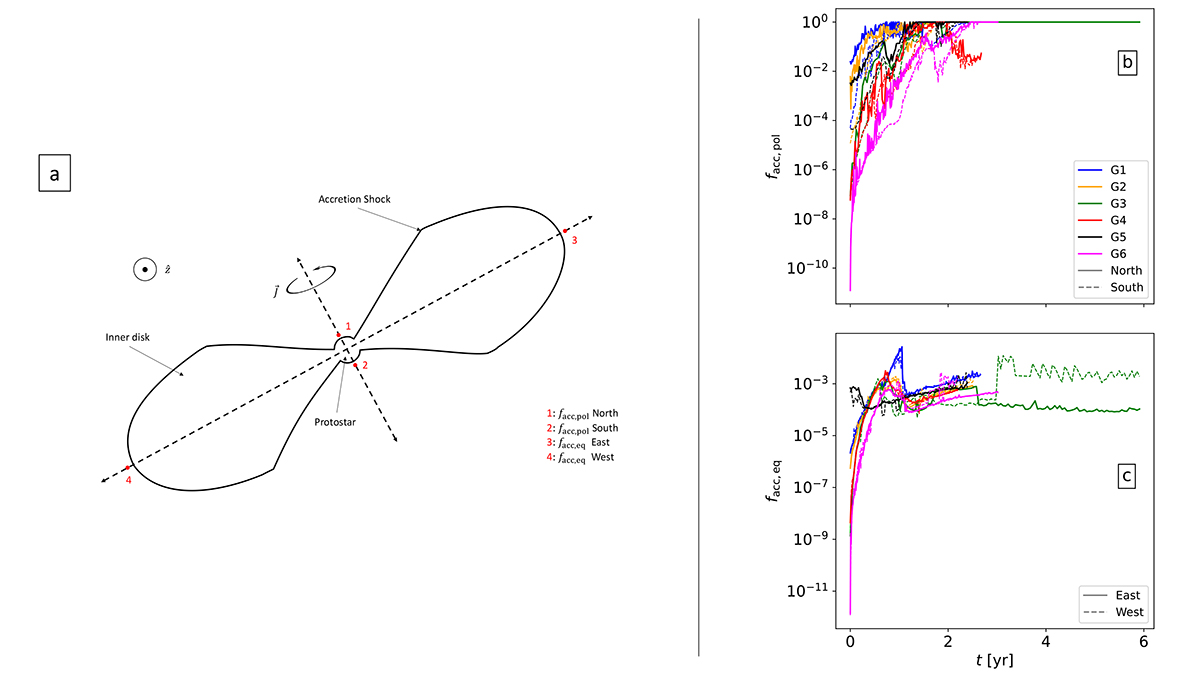
Quantitative analysis of the radiative behavior of the accretion shock. Panel a is a schematic representation of the star and inner disk system, where the solid line is the location of the accretion shock that envelopes both the protostar and the disk. The dashed lines represent four rays launched from the center of the system along which the location of the accretion shock is found and its radiative efficiency measured just upstream from it (numbered red dots). The resulting measurements are presented in panels b and c. North and South (respectively solid and dashed lines in panel b and East and West (respectively solid and dashed lines in panel c are shown for all simulations. These display the polar and equatorial radiative efficiencies (respectively facc, pol and facc, eq; see Eqs. (31) and (32)).
Current usage metrics show cumulative count of Article Views (full-text article views including HTML views, PDF and ePub downloads, according to the available data) and Abstracts Views on Vision4Press platform.
Data correspond to usage on the plateform after 2015. The current usage metrics is available 48-96 hours after online publication and is updated daily on week days.
Initial download of the metrics may take a while.