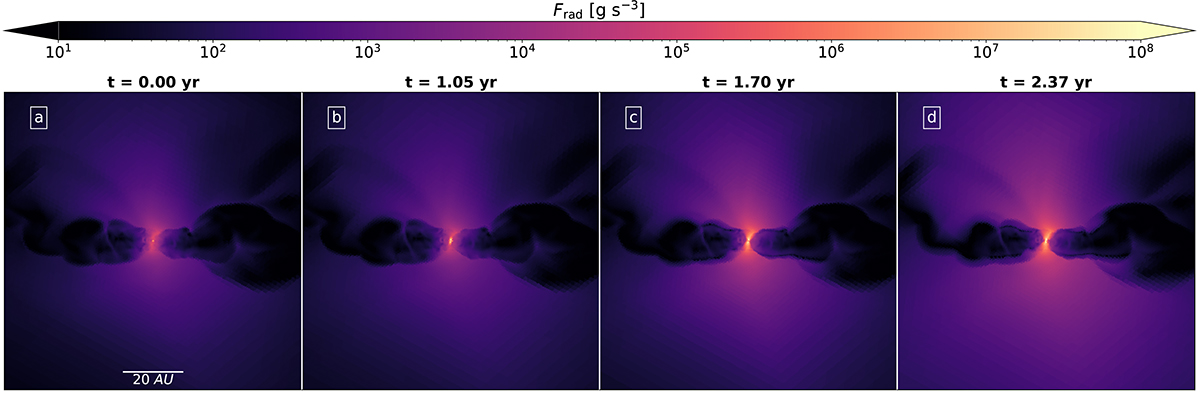
Fig. 14.
Download original image
Edge-on slices through the center of the domain displaying the local radiative flux at different times (see Eq. (1)). Here, t = 0 (panel a) corresponds to the moment of protostellar birth. The data is taken from run G5. The scale bar in panel a applies to all other panels. An animated version of this plot is available online.
Current usage metrics show cumulative count of Article Views (full-text article views including HTML views, PDF and ePub downloads, according to the available data) and Abstracts Views on Vision4Press platform.
Data correspond to usage on the plateform after 2015. The current usage metrics is available 48-96 hours after online publication and is updated daily on week days.
Initial download of the metrics may take a while.