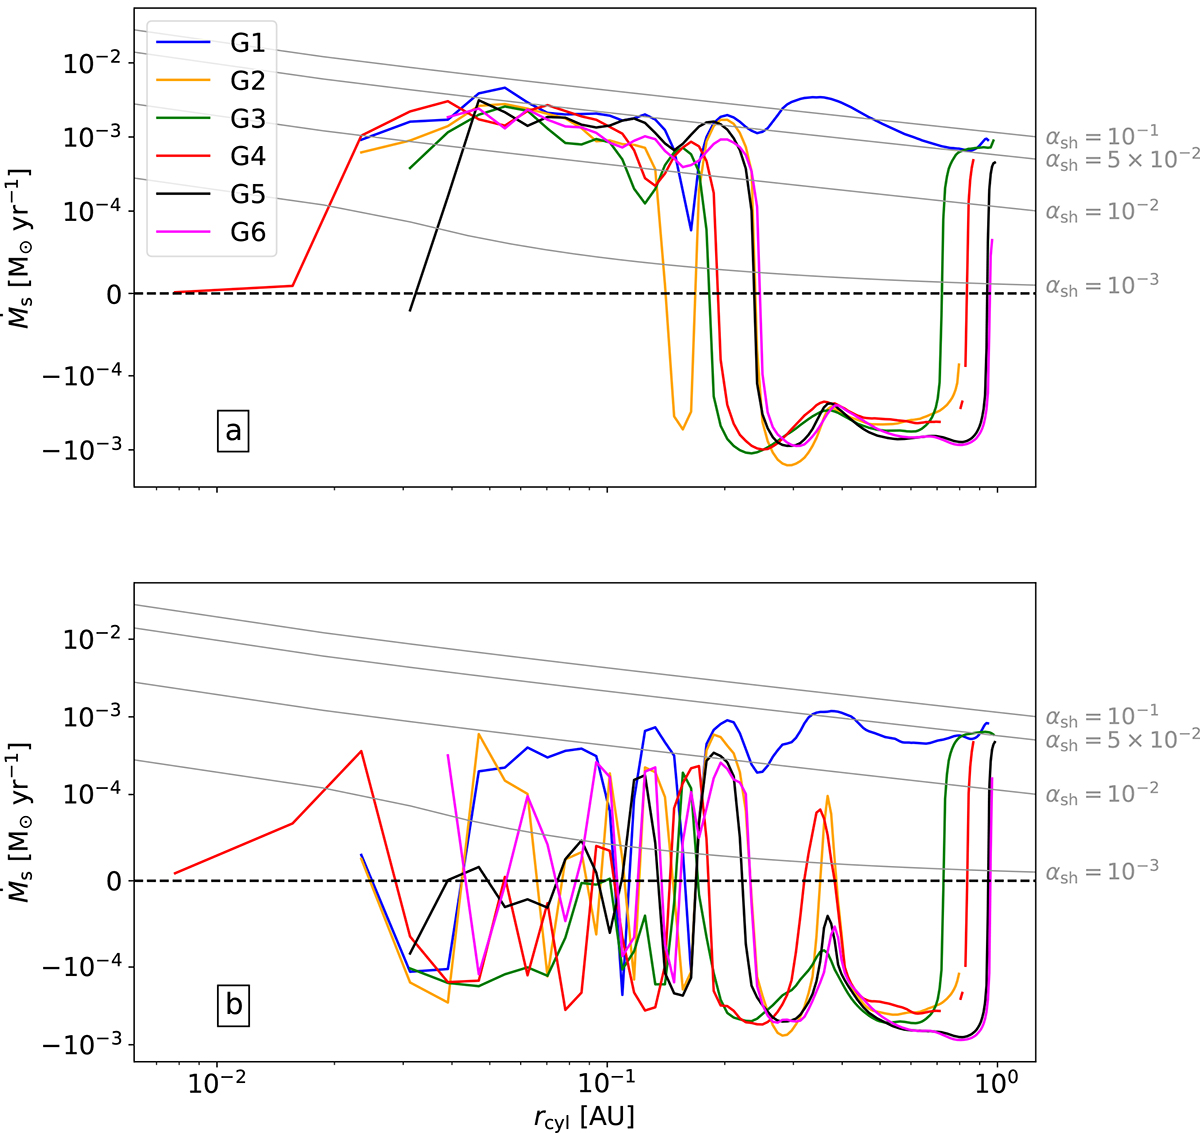
Fig. 13.
Download original image
Radial mass accretion rate within the inner disk for all runs (solid colored lines) as a function of cylindrical radius and computed using Eq. (21) at a moment in time when Rd has reached ≈1 AU. Only cells belonging to the inner disk were used in the computation of Ṁs. Panel a displays the measurements of Ṁs made using ⟨vr⟩z (Eq. (22)), whereas panel b displays the same measurements made using ⟨vr⟩ρ (Eq. (23)). The solid gray lines are analytical estimates of radial transport computed using Eq. (26), with αsh = 10−1 (top), 5 × 10⁻² (middle), and 10−2 (bottom). The other parameters for the solid gray lines are M* ≈ 7 × 10⁻³ M⊙; R* ≈ 3 × 10⁻² AU; cs0 ≈ 5 km s−1; β ≈ 3; ξ ≈ 3/2, and γ ≈ 1.1.
Current usage metrics show cumulative count of Article Views (full-text article views including HTML views, PDF and ePub downloads, according to the available data) and Abstracts Views on Vision4Press platform.
Data correspond to usage on the plateform after 2015. The current usage metrics is available 48-96 hours after online publication and is updated daily on week days.
Initial download of the metrics may take a while.