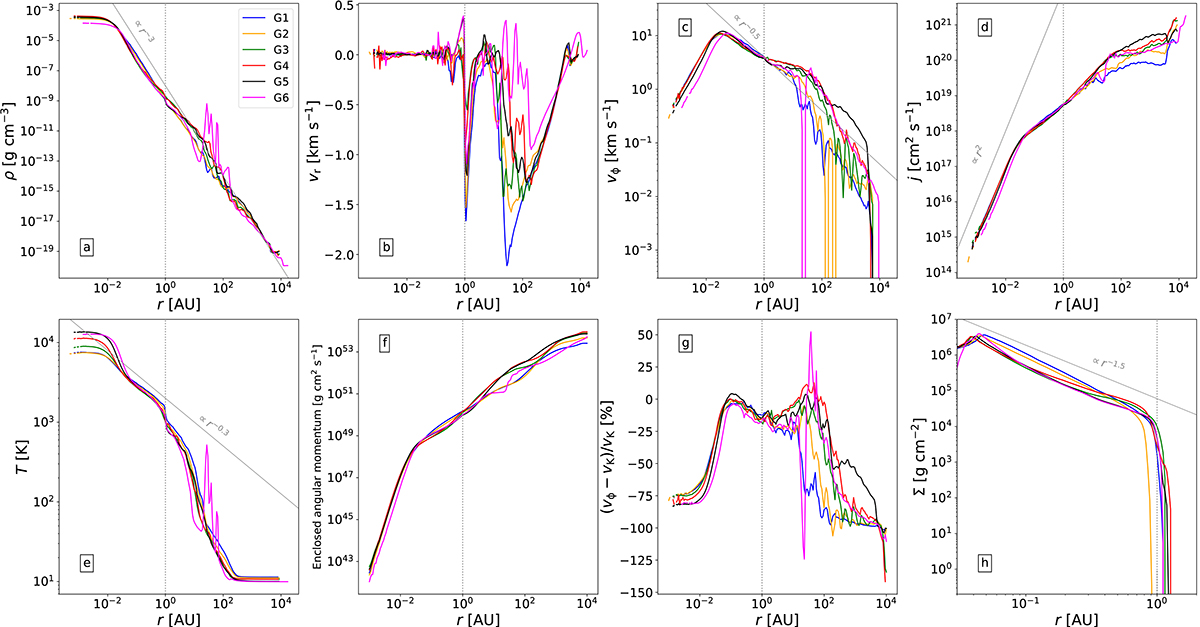
Fig. 12.
Download original image
Studying the structure and kinematics of the gas in our simulations. Panels a–e display a set of azimuthally averaged quantities along the equatorial regions with respect to radius, where the equator was defined as the region where θ/π ∈ [0.45; 0.55] at a moment in time where the inner disk has reached ≈1 AU in radius. Panel a displays the density, panel b shows the radial velocity, panel c presents the azimuthal velocity, panel d shows the specific angular momentum, and panel e presents the temperature. Panel f displays the enclosed angular momentum profile. Panel g displays the deviation from Keplerian rotation along the disk midplane. Panel h displays the column density profile of the inner disk, where non-disk cells were masked.
Current usage metrics show cumulative count of Article Views (full-text article views including HTML views, PDF and ePub downloads, according to the available data) and Abstracts Views on Vision4Press platform.
Data correspond to usage on the plateform after 2015. The current usage metrics is available 48-96 hours after online publication and is updated daily on week days.
Initial download of the metrics may take a while.