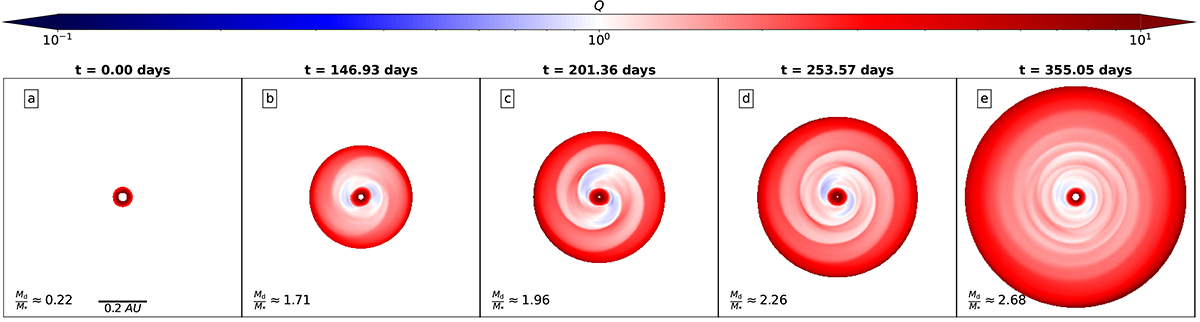
Fig. 11.
Download original image
Top-down slices through the center of the domain of run G1 displaying the real part of the Toomre Q parameter (see Eq. (4)) at different times. Here, t = 0 (panel a) corresponds to the moment of birth of the inner disk. Only cells belonging to the inner disk were used in the calculation of Q. The ratio of the inner disk mass to protostellar mass is displayed on the bottom left of each panel. The scale bar in panel a applies to all other panels. An animated version of this plot is available online.
Current usage metrics show cumulative count of Article Views (full-text article views including HTML views, PDF and ePub downloads, according to the available data) and Abstracts Views on Vision4Press platform.
Data correspond to usage on the plateform after 2015. The current usage metrics is available 48-96 hours after online publication and is updated daily on week days.
Initial download of the metrics may take a while.