Fig. 10.
Download original image
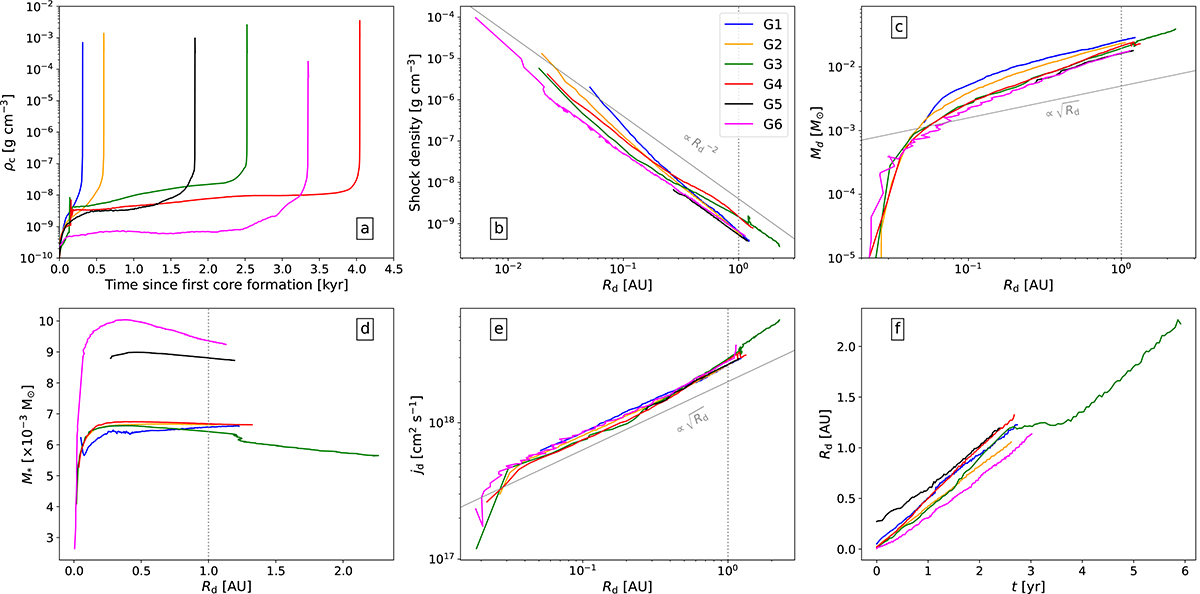
Temporal analysis of the inner disk in all our runs. Blue is for G1, orange for G2, green for G3, red for G4, black for G5, and magenta for G6. Panel a provides the context in which the inner disk is born by displaying the central density’s evolution since the formation of the first Larson core (defined as the moment where ρc > 10−10 g cm−3). Panels b–e respectively display as a function of the inner disk’s equatorial radius Rd (analogous to time) the density of the inner disk’s equatorial shock front, the mass of the inner disk, the protostellar mass, and the specific angular momentum of the inner disk. Panel f displays the evolution of the inner disk radius with respect to time, where t = 0 marks the moment of birth of the inner disk. The gray dotted line in panels b–e marks Rd = 1 AU. (For information on how the inner disk was defined, see Appendix A).
Current usage metrics show cumulative count of Article Views (full-text article views including HTML views, PDF and ePub downloads, according to the available data) and Abstracts Views on Vision4Press platform.
Data correspond to usage on the plateform after 2015. The current usage metrics is available 48-96 hours after online publication and is updated daily on week days.
Initial download of the metrics may take a while.