Fig. 1.
Download original image
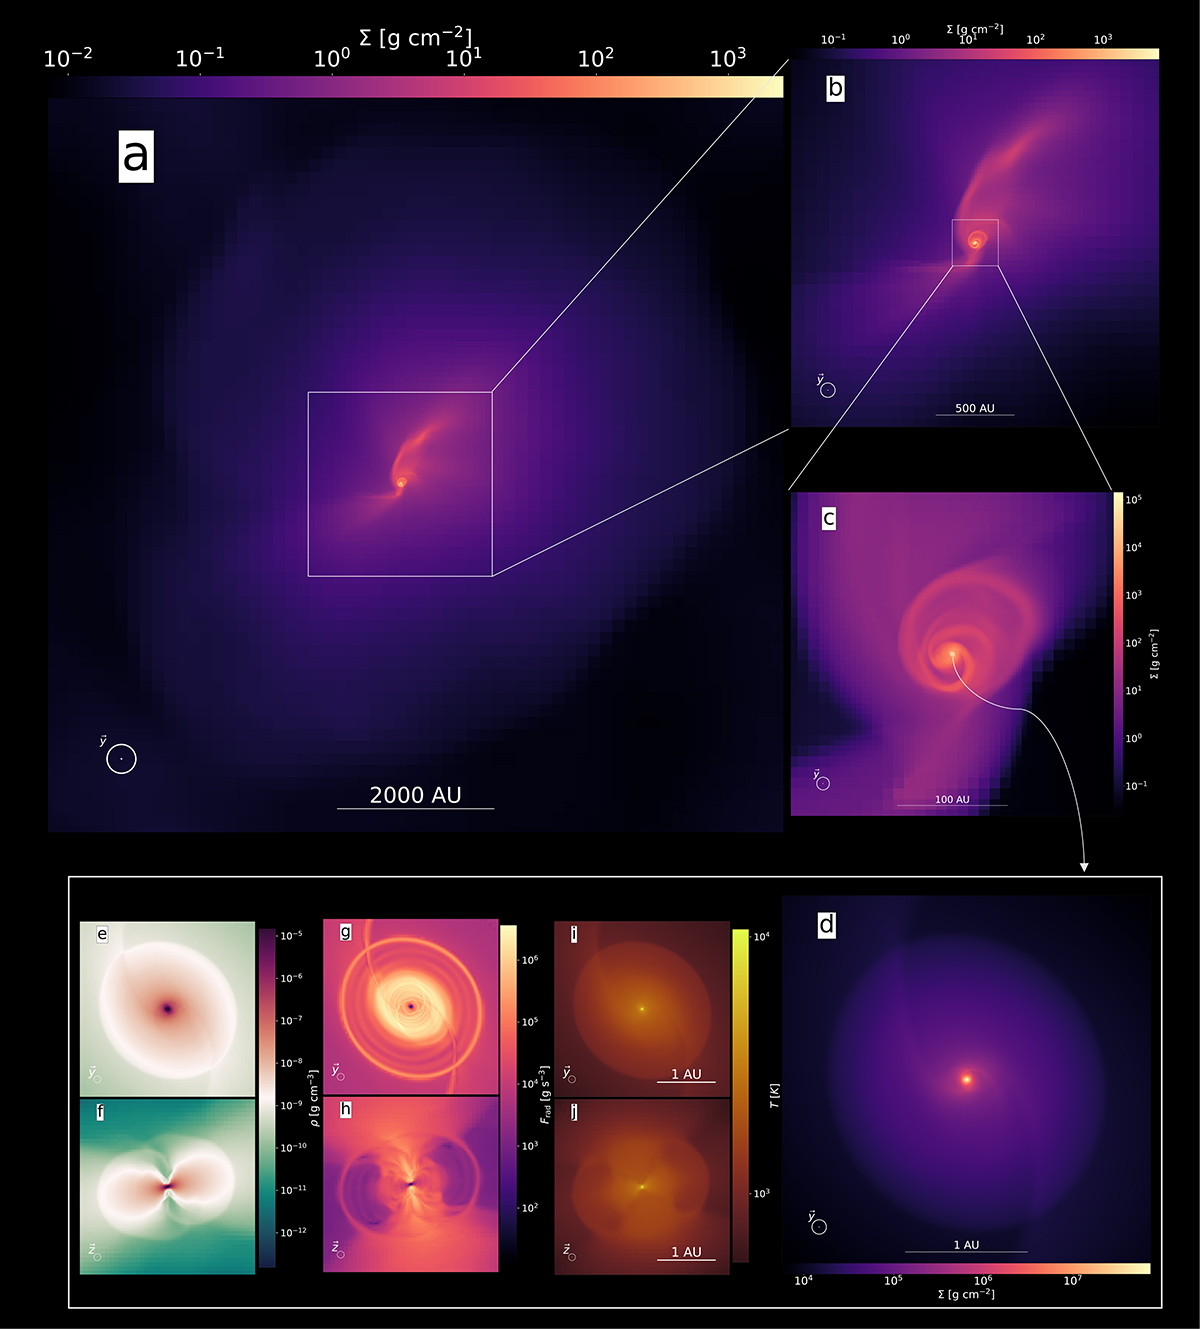
Visualization of the entire dynamical range covered in our simulations. The figure displays data taken from the final snapshot of run G4. Panels a–d show the projected gas column density along the y direction across multiple scales, ranging from ≈9.35 × 10³ AU in panel a to 3 AU in panel d. Panels e–j are slices through the center of the domain along the y direction for panels e, g, and i, and along the z direction for panels f, h, and j. These display density (panels e and f), radiative flux (panels g and h), and temperature (panels i and j). The color bars in panels e and f are centered on the density of the inner disk’s shock front (≈1.5 × 10⁻⁹ g cm−3 at this snapshot).
Current usage metrics show cumulative count of Article Views (full-text article views including HTML views, PDF and ePub downloads, according to the available data) and Abstracts Views on Vision4Press platform.
Data correspond to usage on the plateform after 2015. The current usage metrics is available 48-96 hours after online publication and is updated daily on week days.
Initial download of the metrics may take a while.