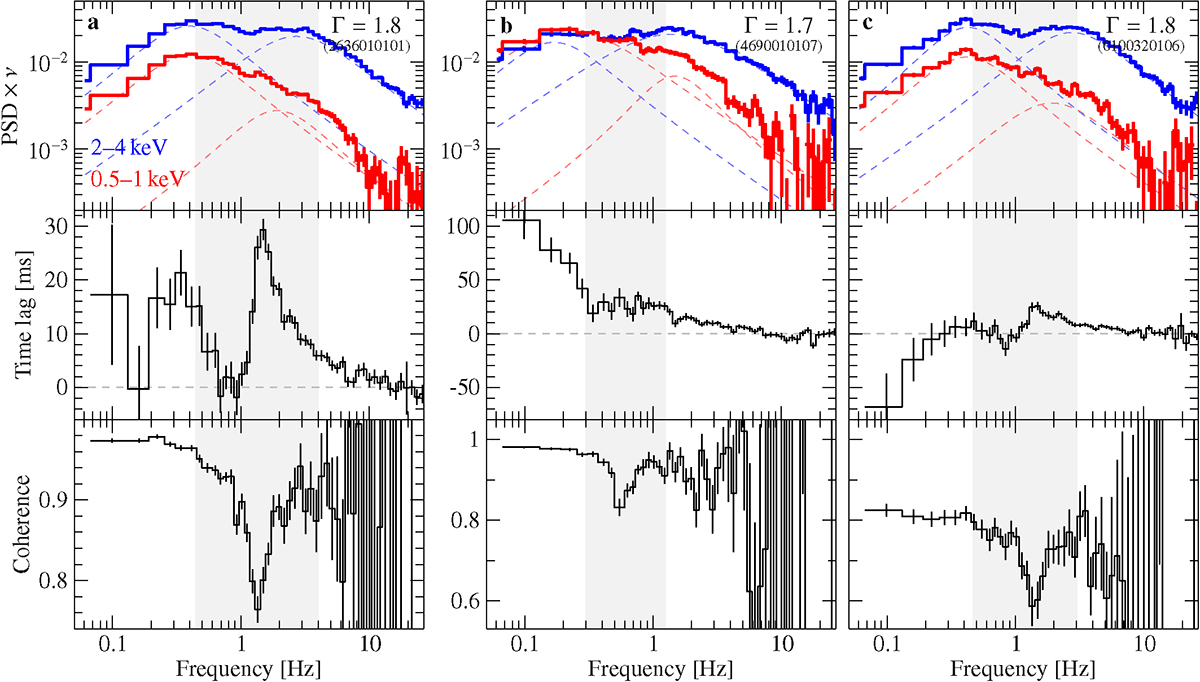
Fig. 13.
Download original image
Timing behavior in the hard state of Cyg X-1. The time lag and coherence are calculated between the 2–4 keV and 0.5–1 keV bands. To guide the eye, the gray shaded region roughly indicates the frequency range of the feature, as indicated by the reduced coherence. (a) Observation 2636010101 (Γ ∼ 1.8) shows the clearest signature of the timing feature in the NICER data. A localized ∼30 ms hard lag at ∼1.6 Hz is present at the overlap region of the L1 and L2 components. The amplitude of L2 is reduced at soft energies. The coherence drops at the peak frequency of the timing feature’s time lag, and appears asymmetric with respect to the time lag. (b) Observation 4690010107 is slightly harder at Γ ∼ 1.7 and shows coherent hard lags at low frequencies. At 0.5 Hz, a coherence drop indicates the presence of the timing feature. The time lag shows a shelf-like structure at this frequency with an amplitude around 30 ms (note that the y-axis is different). (c) Observation 0100320106 is affected by dipping and shows long soft lags at low frequencies at an overall reduced coherence. The timing feature is blended into the lag spectrum with similar amplitude as in the other observations.
Current usage metrics show cumulative count of Article Views (full-text article views including HTML views, PDF and ePub downloads, according to the available data) and Abstracts Views on Vision4Press platform.
Data correspond to usage on the plateform after 2015. The current usage metrics is available 48-96 hours after online publication and is updated daily on week days.
Initial download of the metrics may take a while.