Fig. 8
Download original image
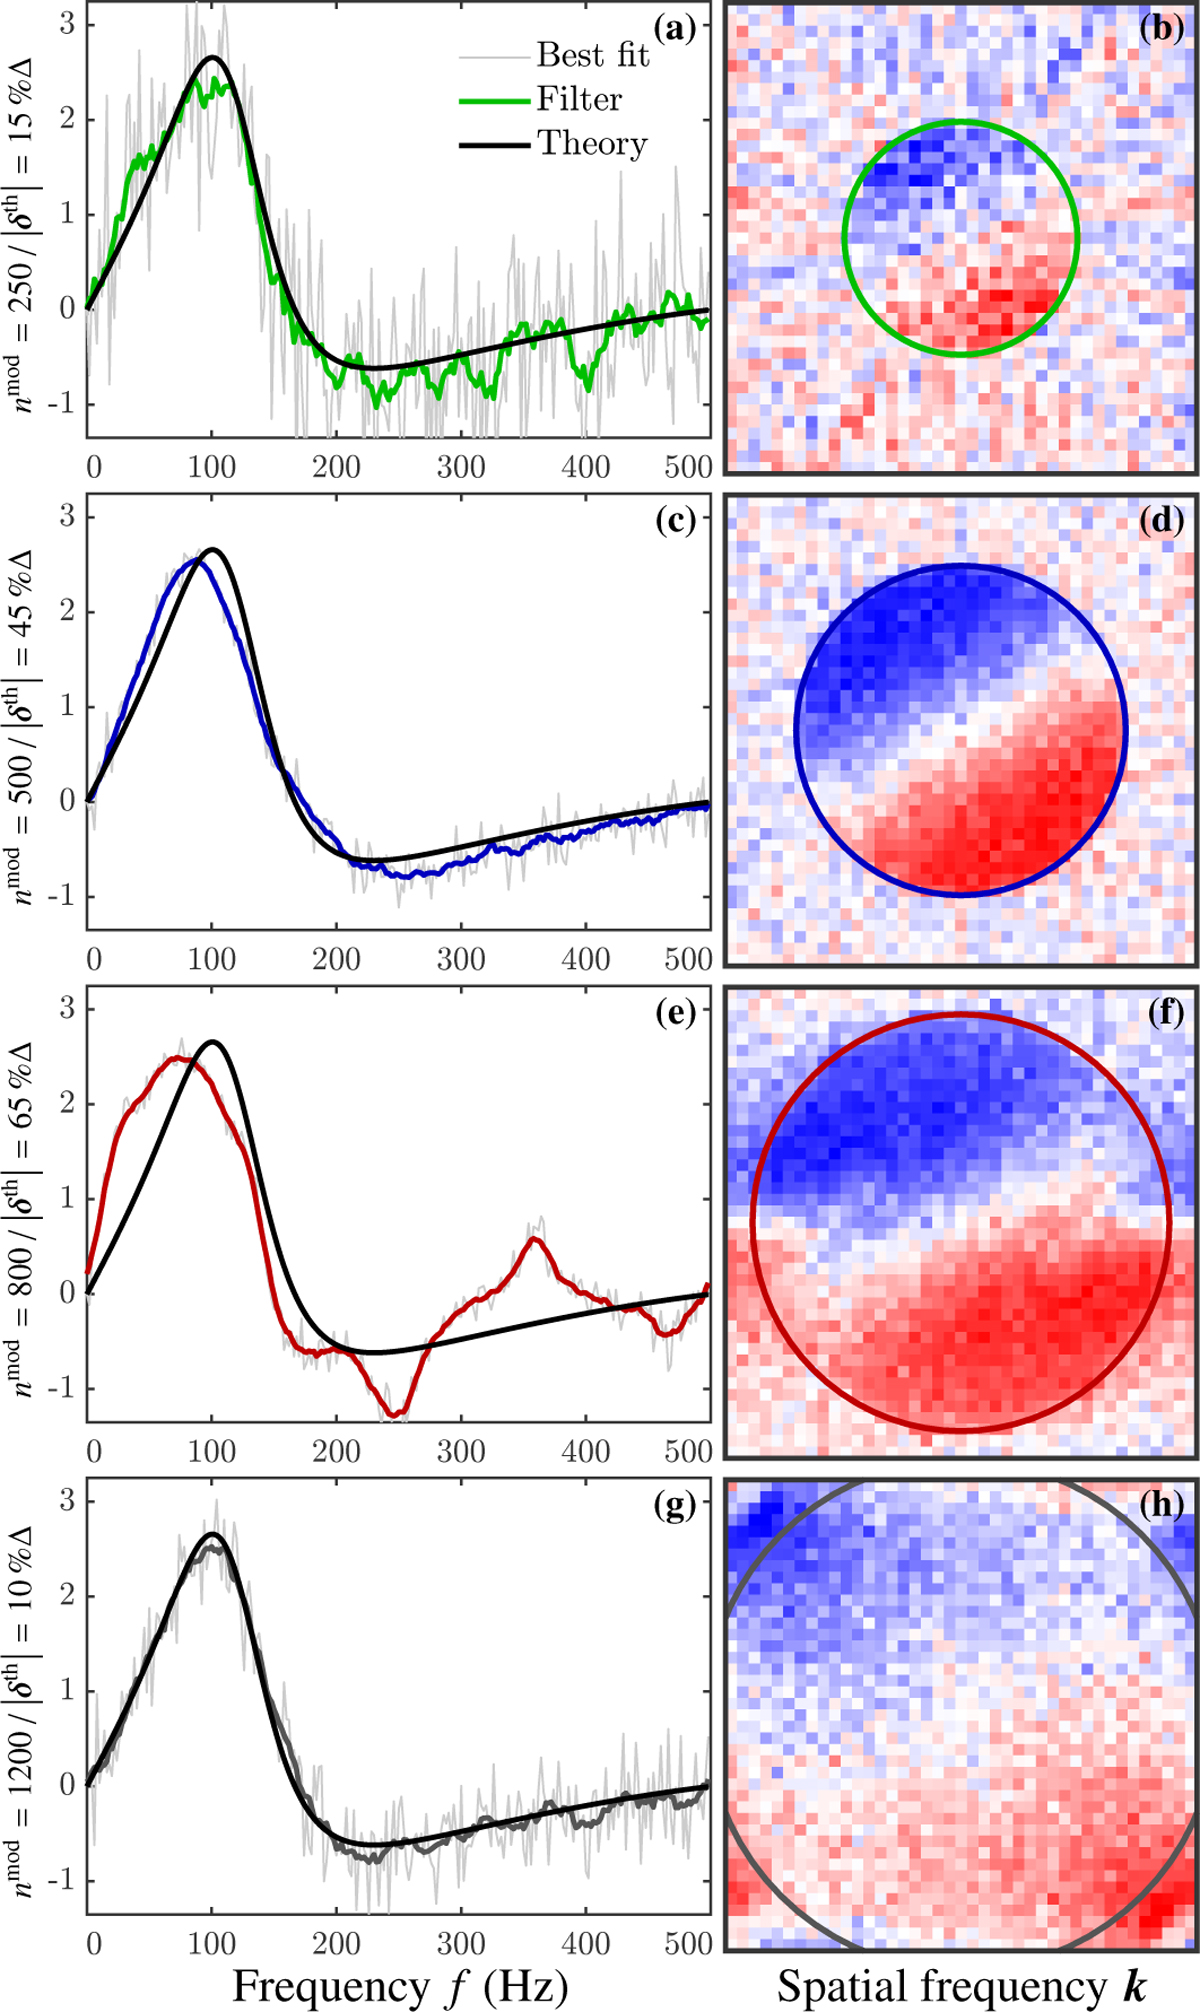
Sanity check of the fits introduced in Fig. 7 (arbitrary unit) for different numbers of controlled modes nmod and shift amplitudes |δth| (![]() [δth] = 60°). Panels a, c, e, g: curves of the best temporal correlation fit
[δth] = 60°). Panels a, c, e, g: curves of the best temporal correlation fit ![]() (grey). Black curves: theoretical correlation curve
(grey). Black curves: theoretical correlation curve ![]() for δ → 0. Coloured curves: mean filter of
for δ → 0. Coloured curves: mean filter of ![]() with a sliding window of ±5 data points. Panels b, d, f, h: maps of the best fit correlation coefficients
with a sliding window of ±5 data points. Panels b, d, f, h: maps of the best fit correlation coefficients ![]() .
.
Current usage metrics show cumulative count of Article Views (full-text article views including HTML views, PDF and ePub downloads, according to the available data) and Abstracts Views on Vision4Press platform.
Data correspond to usage on the plateform after 2015. The current usage metrics is available 48-96 hours after online publication and is updated daily on week days.
Initial download of the metrics may take a while.