Fig. 7
Download original image
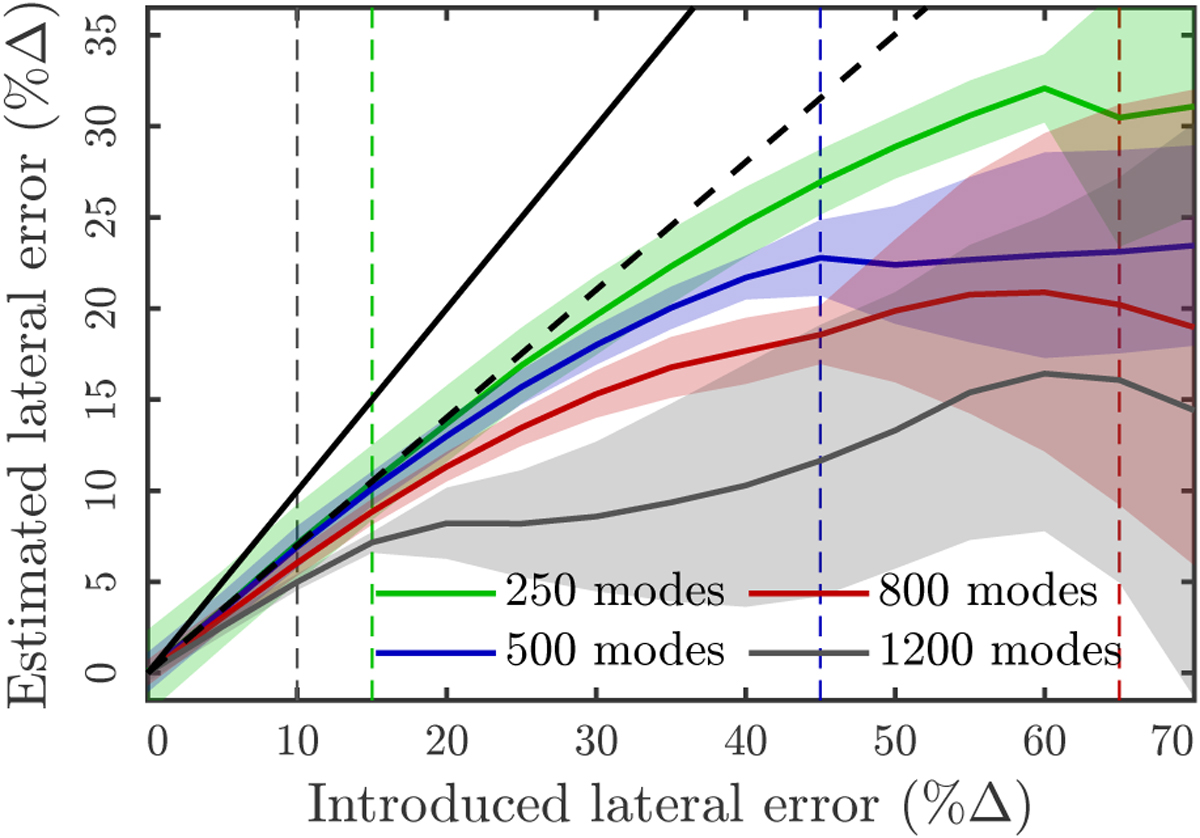
Sensitivity of the closed loop estimator for different numbers of controlled modes in the noise limited regime (coloured curves). The coloured areas emphasise the ±3 σ regions. The black dashed (resp. plain) line is the fitted (resp. theoretical) sensitivity of gcl ≃ 0.7 (resp. 1). The coloured dashed lines emphasise the lateral error at which the panels of Fig. 8 are displayed.
Current usage metrics show cumulative count of Article Views (full-text article views including HTML views, PDF and ePub downloads, according to the available data) and Abstracts Views on Vision4Press platform.
Data correspond to usage on the plateform after 2015. The current usage metrics is available 48-96 hours after online publication and is updated daily on week days.
Initial download of the metrics may take a while.