Fig. 2
Download original image
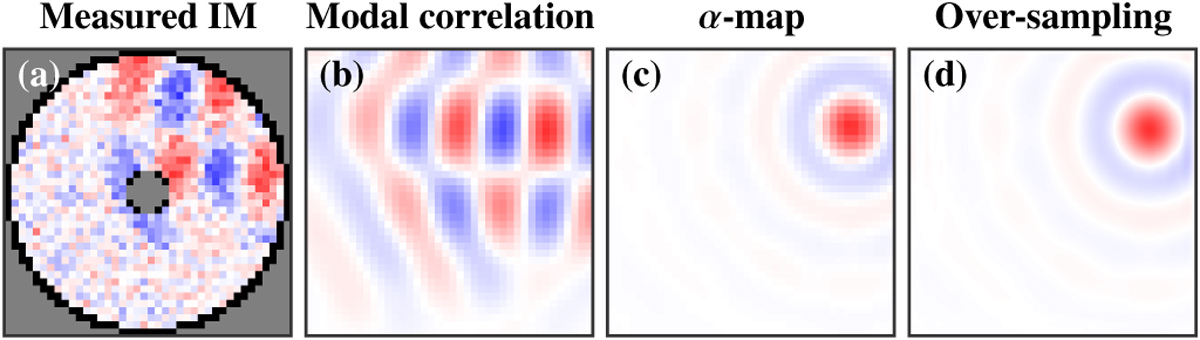
Simulated example of the spatial 2D correlation method. Panel a: simulation of a measured and shifted modal IM (x-slopes) for mKL = 35. The grey and dark pixels correspond to the non-valid slopes wvalid(x) = 0 in the measured IM. Panel b: cross-correlation of the shifted mode of Panel a with the reference modal IM for mKL = 35 (see Fig. 1). Panel c: map of the fitted coefficients α. Panel d: over-sampling of panel c with an interpolation via sinc functions.
Current usage metrics show cumulative count of Article Views (full-text article views including HTML views, PDF and ePub downloads, according to the available data) and Abstracts Views on Vision4Press platform.
Data correspond to usage on the plateform after 2015. The current usage metrics is available 48-96 hours after online publication and is updated daily on week days.
Initial download of the metrics may take a while.