Fig. C.1

Download original image
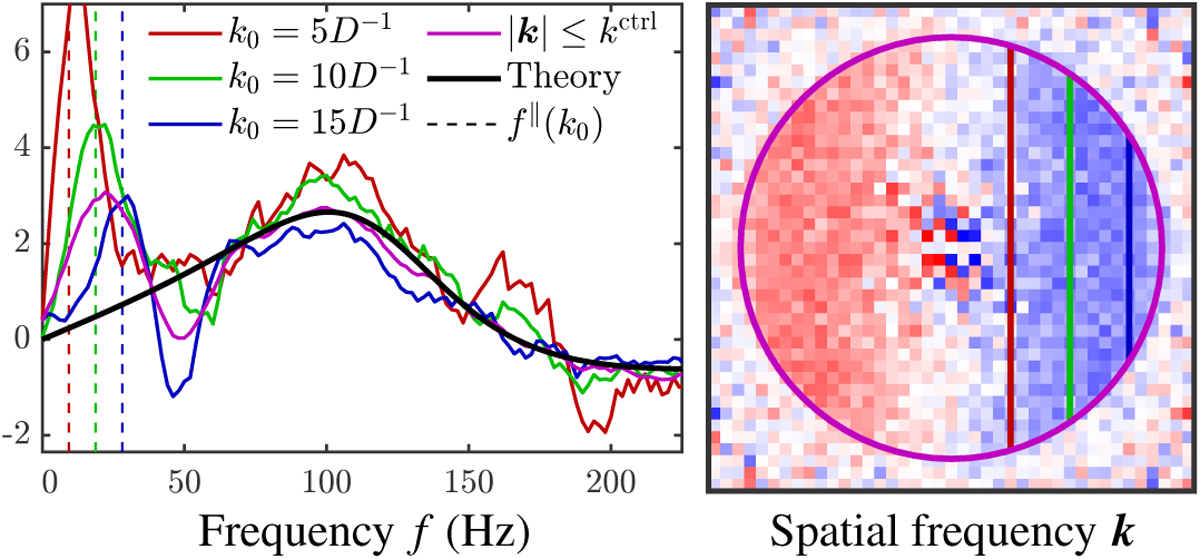
Impact on the temporal correlation curves ![]() (left panel) and the map of the best fit correlation coefficients
(left panel) and the map of the best fit correlation coefficients ![]() (right panel) of a frozen flow perturbation of wind speed υ0 = 15 m s−1 aligned with a lateral error of δx = −20 %A in a noise limited regime nph = 10 and controlling nmod = 800. Coloured curves: best temporal correlation fit
(right panel) of a frozen flow perturbation of wind speed υ0 = 15 m s−1 aligned with a lateral error of δx = −20 %A in a noise limited regime nph = 10 and controlling nmod = 800. Coloured curves: best temporal correlation fit ![]() for different sets of controlled modes (mean filter with a sliding window of ±3 data points). Black curves: theoretical correlation curve
for different sets of controlled modes (mean filter with a sliding window of ±3 data points). Black curves: theoretical correlation curve ![]() . The coloured dashed lines emphasise the temporal frequencies f‖ = k0υ0 associated with the spatial frequencies k0 highlighted on the right panel.
. The coloured dashed lines emphasise the temporal frequencies f‖ = k0υ0 associated with the spatial frequencies k0 highlighted on the right panel.
Current usage metrics show cumulative count of Article Views (full-text article views including HTML views, PDF and ePub downloads, according to the available data) and Abstracts Views on Vision4Press platform.
Data correspond to usage on the plateform after 2015. The current usage metrics is available 48-96 hours after online publication and is updated daily on week days.
Initial download of the metrics may take a while.


