Fig. 11
Download original image
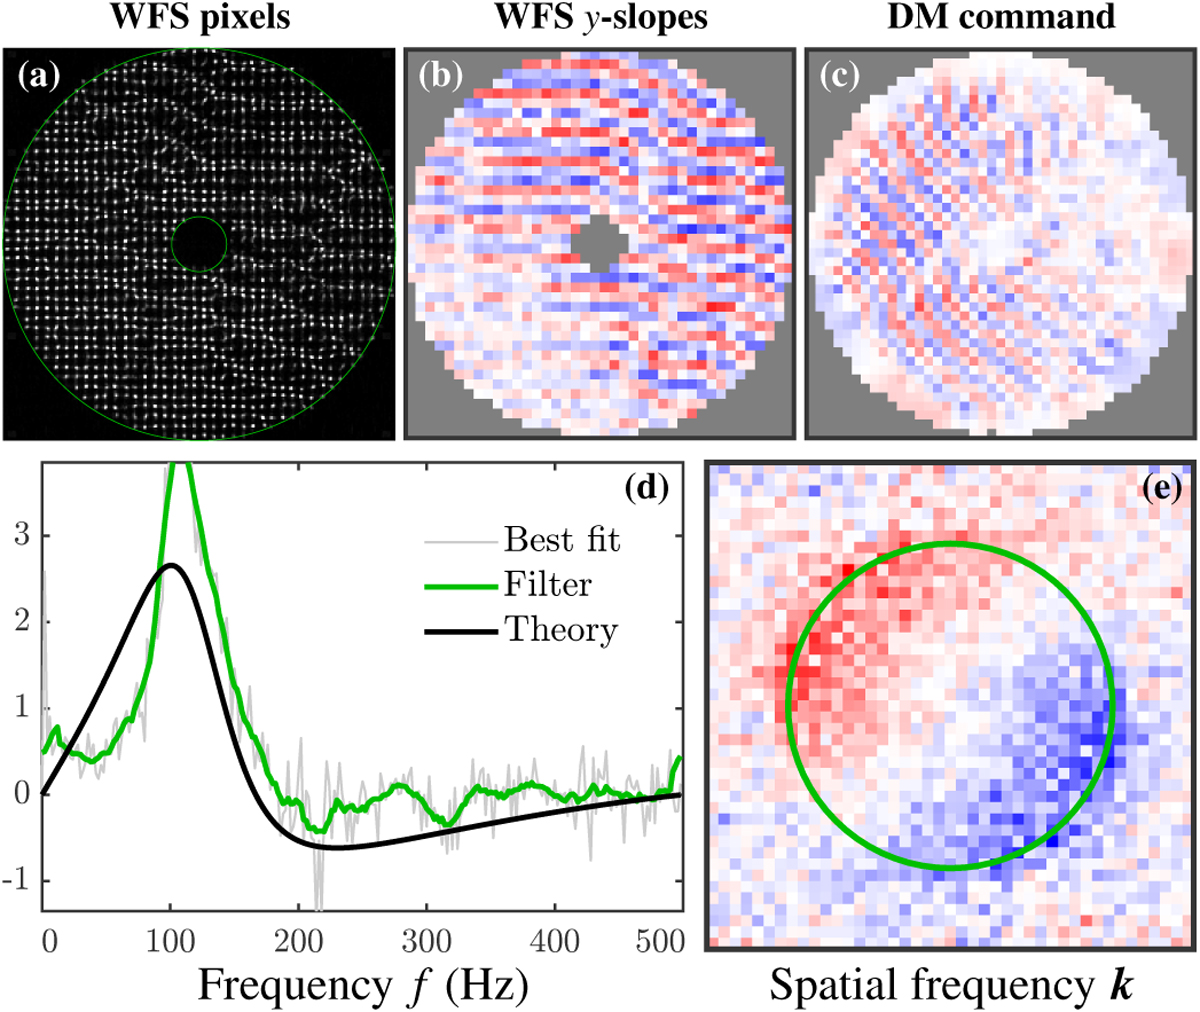
Example in the GPAO bench of the closed loop estimator. Panels a, b, c: SH-WFS pixel frame, WFS y-slopes and DM commands at the limit of stability before the alignment. Green circles: WFS pupil edges. Panel d: curves of the best temporal correlation fit ![]() (grey), of the mean filter of
(grey), of the mean filter of ![]() with a sliding window of ±5 data points (green), and of the theoretical correlation
with a sliding window of ±5 data points (green), and of the theoretical correlation ![]() (black). Panel e: map of the best fit correlation coefficients
(black). Panel e: map of the best fit correlation coefficients ![]() . The green circle encompasses the frequency space theoretically controlled by the command matrix.
. The green circle encompasses the frequency space theoretically controlled by the command matrix.
Current usage metrics show cumulative count of Article Views (full-text article views including HTML views, PDF and ePub downloads, according to the available data) and Abstracts Views on Vision4Press platform.
Data correspond to usage on the plateform after 2015. The current usage metrics is available 48-96 hours after online publication and is updated daily on week days.
Initial download of the metrics may take a while.