Fig. 1
Download original image
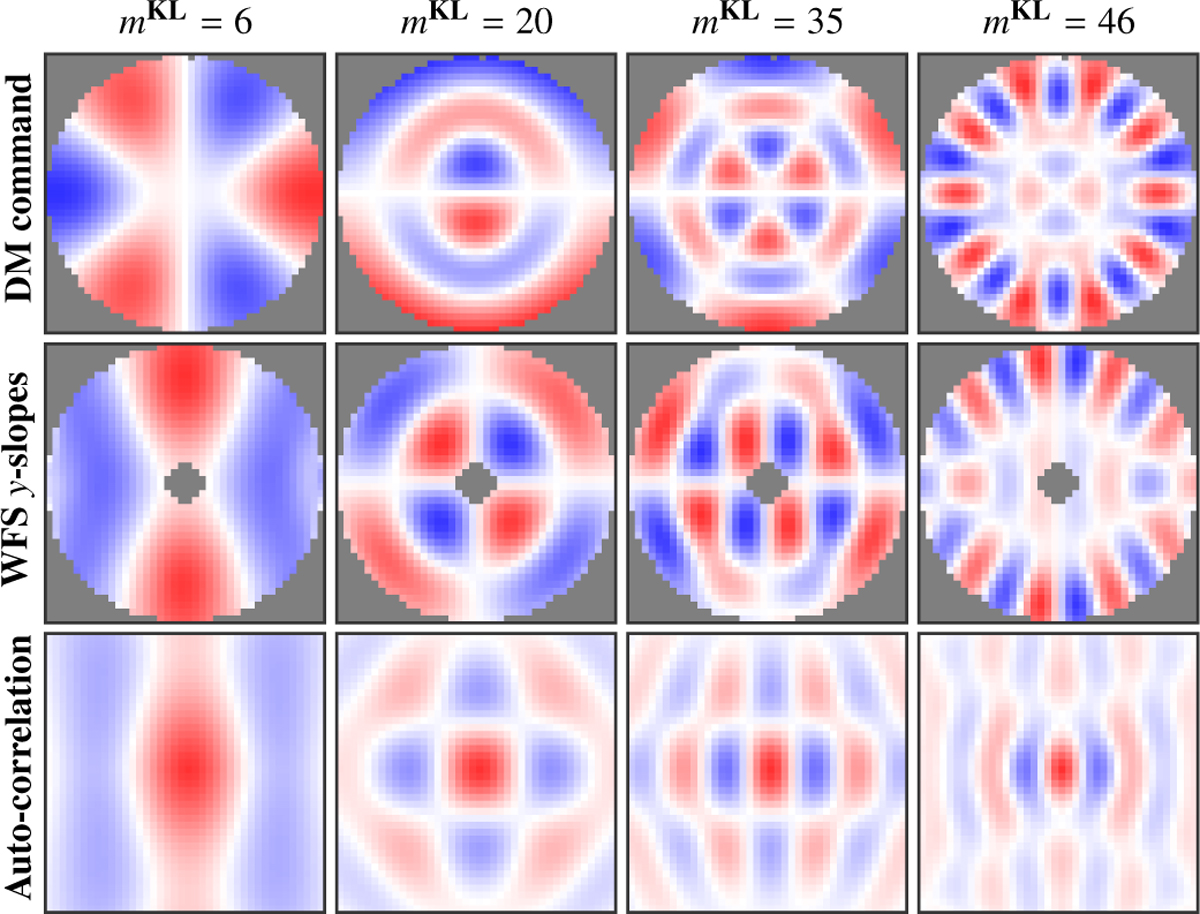
General idea of the spatial 2D correlation method for different KL modes mKL ∈ {6, 20, 35, 46}. When different modes are applied on the DM (first line), the patterns seen by the WFS show different spatial scales (second line). The grey pixels correspond to the missing slopes wWFS (x) = 0 in the PSIM model that are hidden by the pupil. A lateral mis-registration would shift the peak in the correlation between the PSIM and the measured IM (third line).
Current usage metrics show cumulative count of Article Views (full-text article views including HTML views, PDF and ePub downloads, according to the available data) and Abstracts Views on Vision4Press platform.
Data correspond to usage on the plateform after 2015. The current usage metrics is available 48-96 hours after online publication and is updated daily on week days.
Initial download of the metrics may take a while.