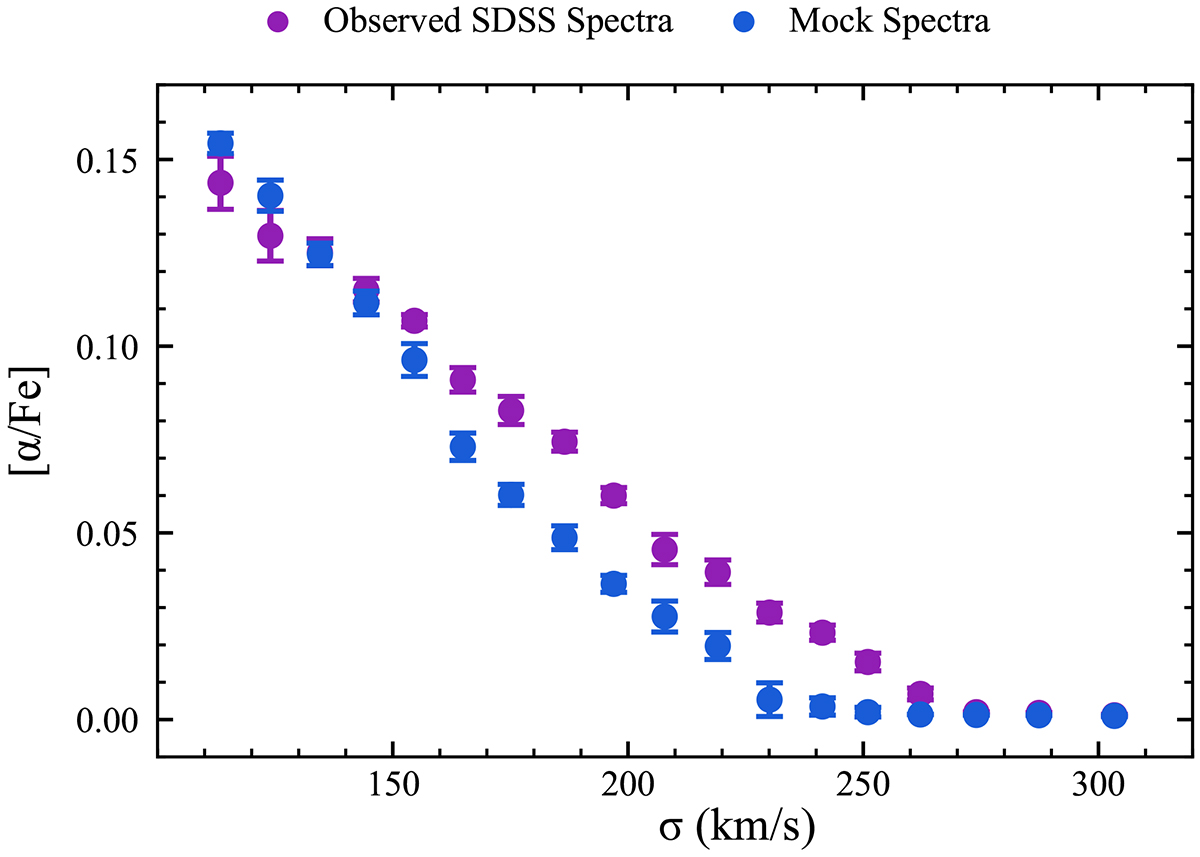
Fig. 3.
Download original image
[α/Fe]–σ relation measured from the mock spectra. The blue circles represent the results obtained for the mock spectra that include different abundance patterns for individual α-elements as measured in Beverage et al. 2023; (updated results from Conroy et al. 2014). The filled purple circles again represent the results found in Fig. 1 for comparison purposes.
Current usage metrics show cumulative count of Article Views (full-text article views including HTML views, PDF and ePub downloads, according to the available data) and Abstracts Views on Vision4Press platform.
Data correspond to usage on the plateform after 2015. The current usage metrics is available 48-96 hours after online publication and is updated daily on week days.
Initial download of the metrics may take a while.