Fig. 2.
Download original image
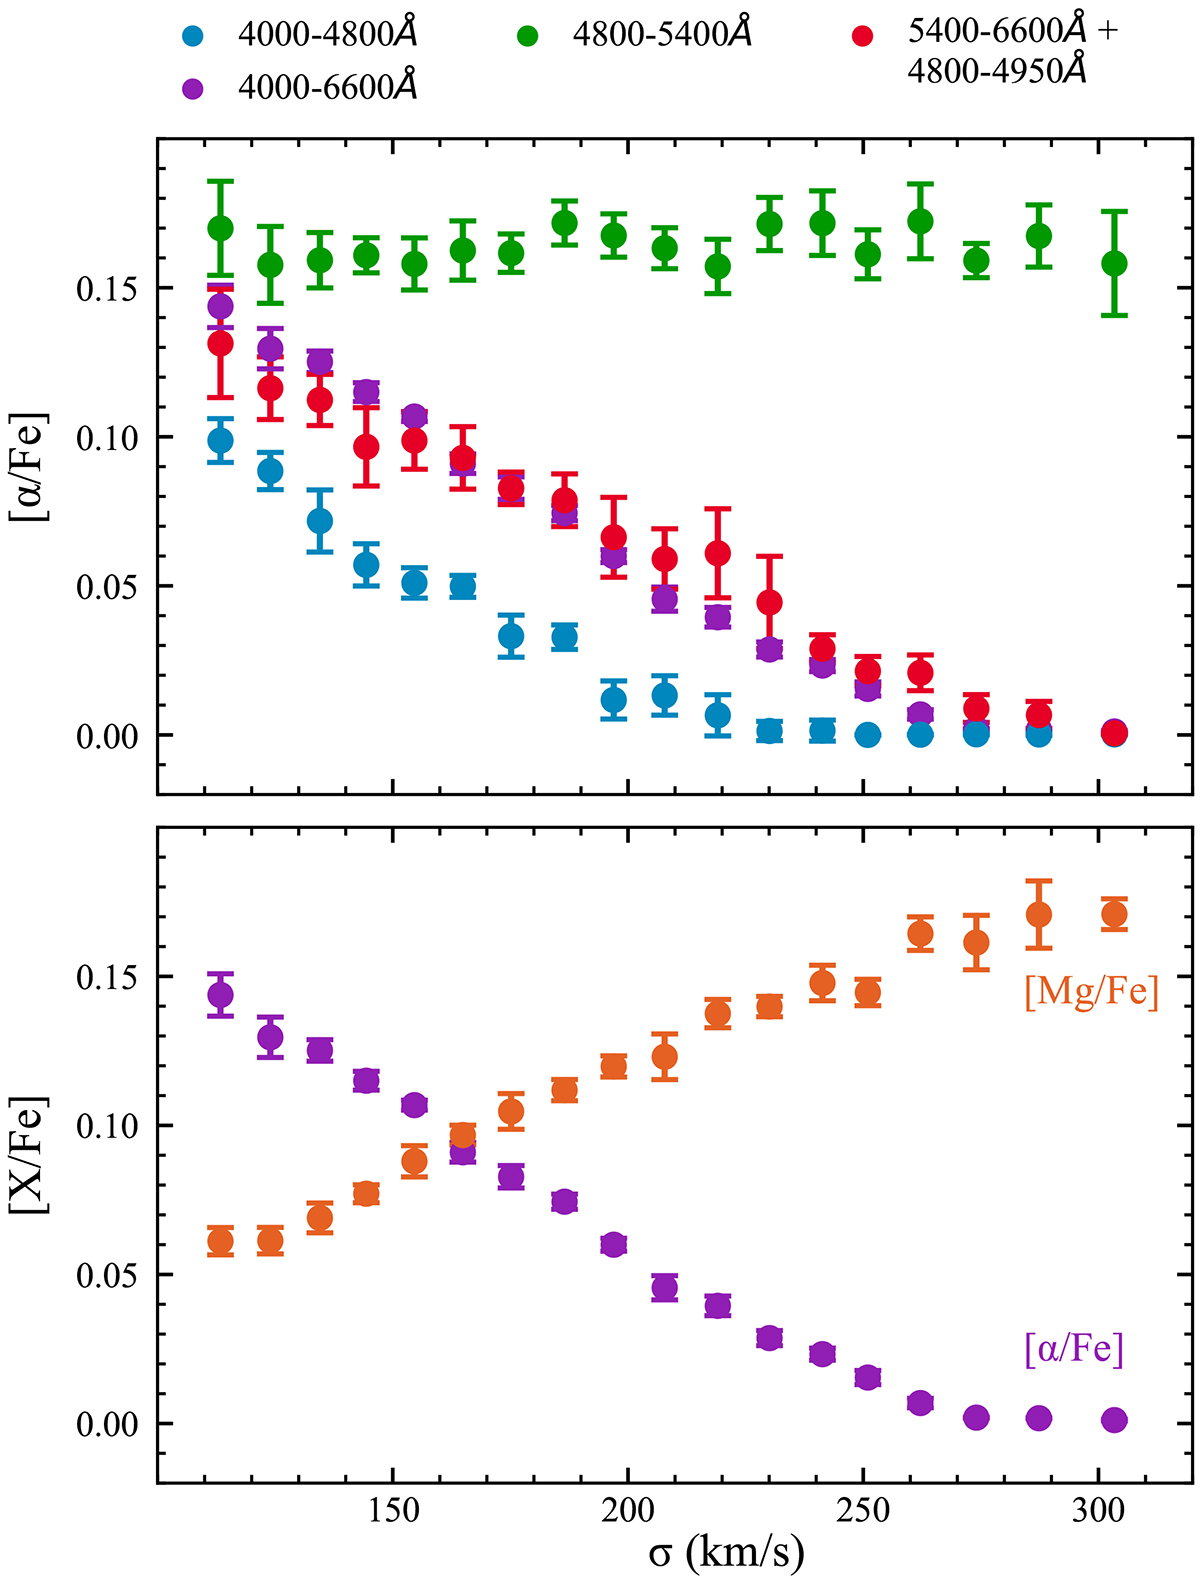
Further measures of [α/Fe], and [Mg/Fe]. Top panel: [α/Fe]–σ relation obtained by fitting the SDSS data over different wavelength ranges: 4000–4800 Å (blue), 4800–5400 Å (green), and 5400–6600 Å including the Hβ region (red). Bottom panel: [X/Fe]–σ relation using magnesium-enhanced models (orange). These models combine the MILES Vazdekis et al. (2015) and the Conroy & Dokkum (2012b) predictions (see details in the text). For reference, the filled purple circles in both panels represent the results from Fig. 1.
Current usage metrics show cumulative count of Article Views (full-text article views including HTML views, PDF and ePub downloads, according to the available data) and Abstracts Views on Vision4Press platform.
Data correspond to usage on the plateform after 2015. The current usage metrics is available 48-96 hours after online publication and is updated daily on week days.
Initial download of the metrics may take a while.