Fig. 1.
Download original image
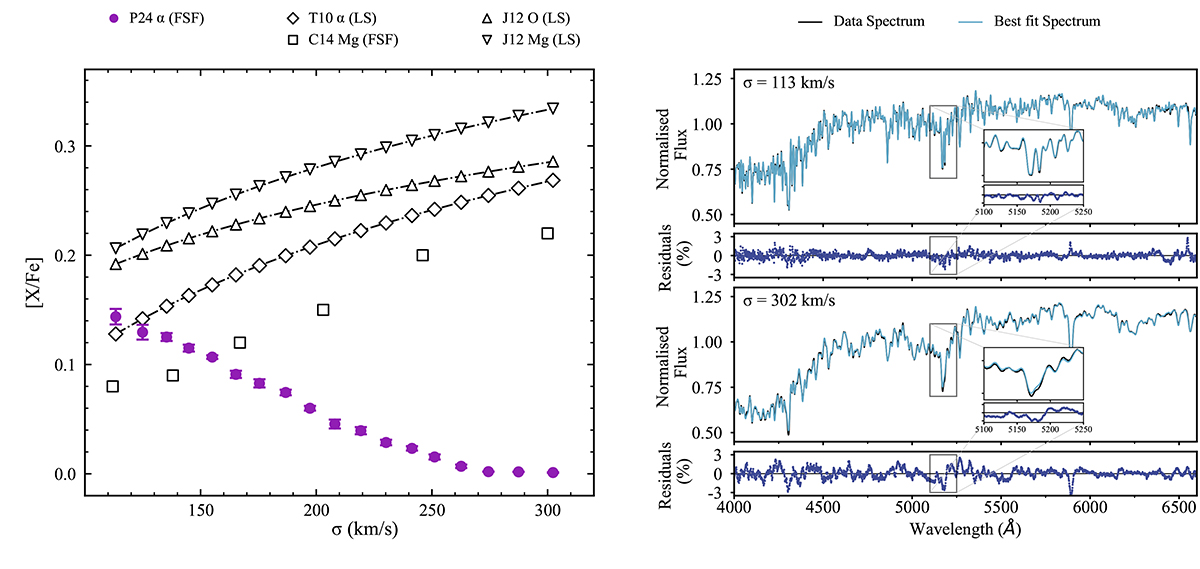
Measure of [α/Fe] on SDSS stacked spectra and associated best-fit spectra. Left panel: Elemental abundances as a function of the velocity dispersion for ETGs. Empty symbols correspond to literature measurements of different α elements. The diamonds indicate average [α/Fe] from Thomas et al. (2010), up and down triangles are oxygen and magnesium as measured by Johansson et al. (2012), and squares show the [Mg/Fe] trend of Conroy et al. (2014). The filled purple circles show the best-fitting (but misleading) pPXF+MILES solution. Right panels: Spectra for the lowest (top panel) and highest (bottom panel) σ bin. The observed stacked spectrum is given in black and the best-fit spectrum in cyan. The residuals are shown in blue. We also provide a zoom-in into the Mgb region.
Current usage metrics show cumulative count of Article Views (full-text article views including HTML views, PDF and ePub downloads, according to the available data) and Abstracts Views on Vision4Press platform.
Data correspond to usage on the plateform after 2015. The current usage metrics is available 48-96 hours after online publication and is updated daily on week days.
Initial download of the metrics may take a while.