Fig. 9.
Download original image
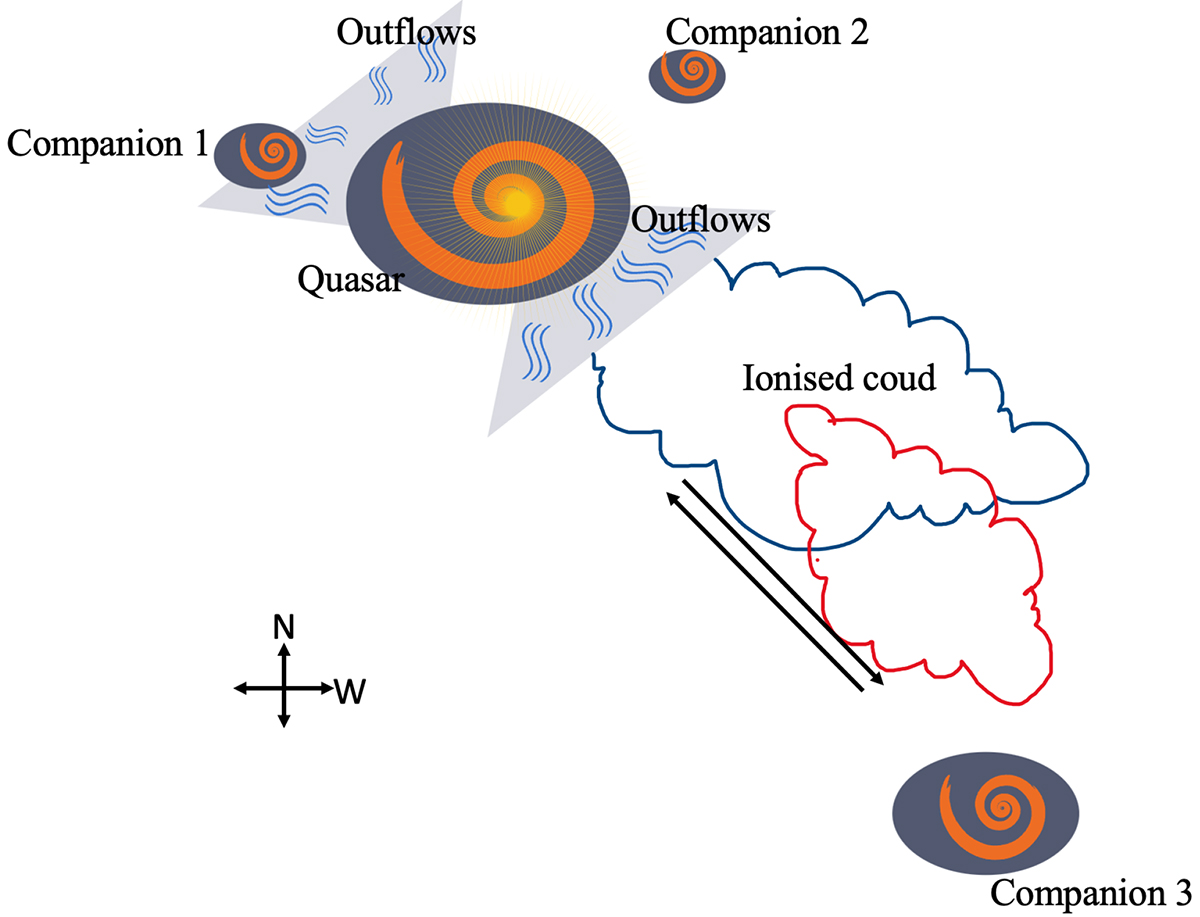
Cartoon showing the quasar (ID 608) and the deductions we have made based on analysis of the data, velocity maps and flux maps. The companion galaxies are marked. The outflows are shown in the northeast (NE) and southwest (SW) directions, which we have denoted on the diagram. The extended structure is indicated as an ionised cloud in red and blue colours that indicate the receding and approaching movement of the cloud as seen in Fig. 2. The possible interaction between the quasar and C3 is denoted by the black arrows. The distances are not to scale. There is no meaning attached to the sizes of the galaxies and outflows.
Current usage metrics show cumulative count of Article Views (full-text article views including HTML views, PDF and ePub downloads, according to the available data) and Abstracts Views on Vision4Press platform.
Data correspond to usage on the plateform after 2015. The current usage metrics is available 48-96 hours after online publication and is updated daily on week days.
Initial download of the metrics may take a while.