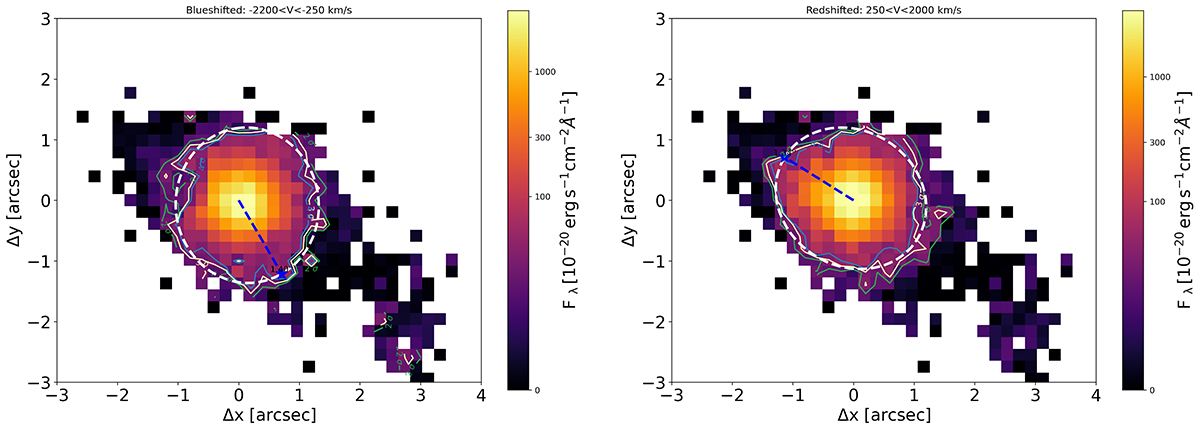
Fig. 8.
Download original image
Flux maps for the blue-shifted and red-shifted velocities from the multi-Gaussian fitting. We select the region [−2200, −250] km s−1 to extract the flux map for negative velocities (the left panel). In the right panel, the flux map for the positive velocities [250, 2000] km s−1. The light blue, yellow, and green contours indicate the 4, 3, and 2σ levels, respectively. These contours help to determine the significance level of the measured flux values. The blue dashed line represents the maximum distance to the 3σ fitted ellipse in white.
Current usage metrics show cumulative count of Article Views (full-text article views including HTML views, PDF and ePub downloads, according to the available data) and Abstracts Views on Vision4Press platform.
Data correspond to usage on the plateform after 2015. The current usage metrics is available 48-96 hours after online publication and is updated daily on week days.
Initial download of the metrics may take a while.