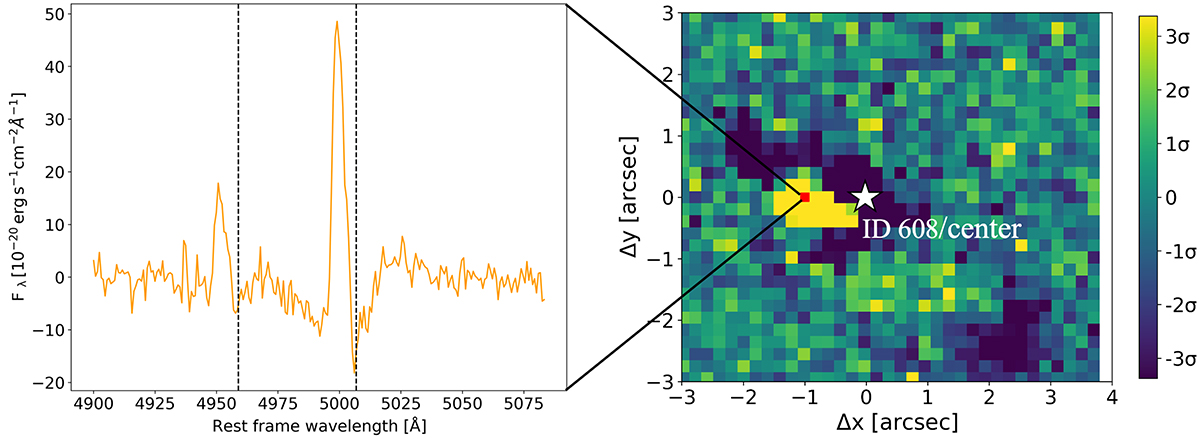
Fig. 6.
Download original image
Residual spectrum and map after PSF subtraction show that the [O III] emission in our quasar is resolved. The left panel shows the residual spectrum analysis of a randomly selected pixel. The two vertical lines serve as markers highlighting the wavelengths of [O III]λ5007 and [O III]λ4949 emission lines for the centre of ID 608. The right panel showcases a residual map resulting from collapsing the residual spectrum of each pixel. The red square on the right panel corresponds to the specific pixel from which the residue spectrum was extracted in the left panel and the centre is marked by a white star.
Current usage metrics show cumulative count of Article Views (full-text article views including HTML views, PDF and ePub downloads, according to the available data) and Abstracts Views on Vision4Press platform.
Data correspond to usage on the plateform after 2015. The current usage metrics is available 48-96 hours after online publication and is updated daily on week days.
Initial download of the metrics may take a while.