Fig. 5.
Download original image
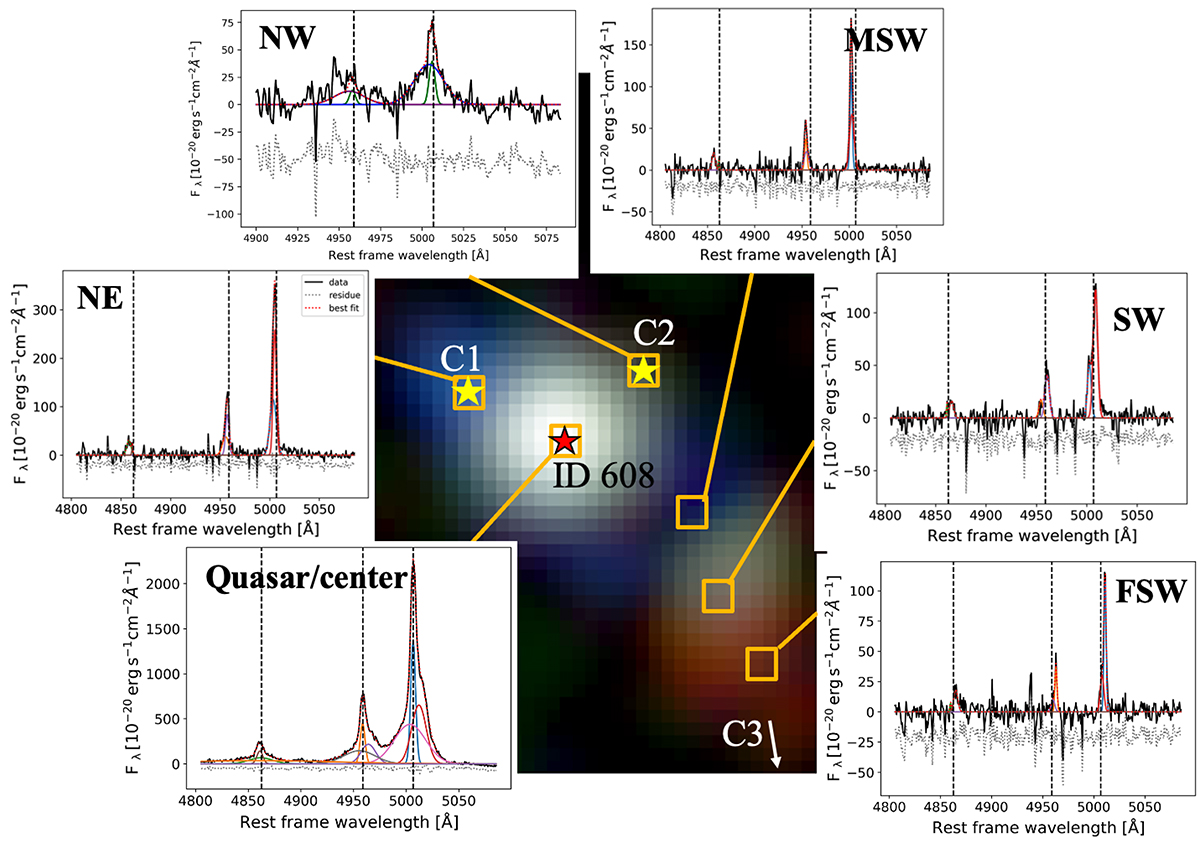
Spectra relative from the six regions shown in Fig. 2. The spectra are extracted from a small area of a 0.6″ × 0.6″ box at the given position in the FOV similar to Fig. 2f. Within the six regions shown, only the nuclear region and NE are best fitted by more than two Gaussian functions. One or two Gaussian components can adequately describe all the remaining spectra. The legend for all the spectra is represented in the spectrum from the NE region where the black solid spectrum shows the data, the red dotted shows the best fit, the grey dotted spectrum shows the residual and all the other colours (blue, magenta, solid red, green) show the different components fitted. The three vertical lines highlight the centres of the Hβλ4861, [O III]λ4949 and [O III]λ5007 emission lines. The yellow stars indicate the positions of C1 and C2. In the bottom right of the map, the white arrow points towards the position of C3 that is outside this map size. The different regions that is NE, NW, MSW, SW, FSW and ID 608 are indicated in the respective spectrum.
Current usage metrics show cumulative count of Article Views (full-text article views including HTML views, PDF and ePub downloads, according to the available data) and Abstracts Views on Vision4Press platform.
Data correspond to usage on the plateform after 2015. The current usage metrics is available 48-96 hours after online publication and is updated daily on week days.
Initial download of the metrics may take a while.