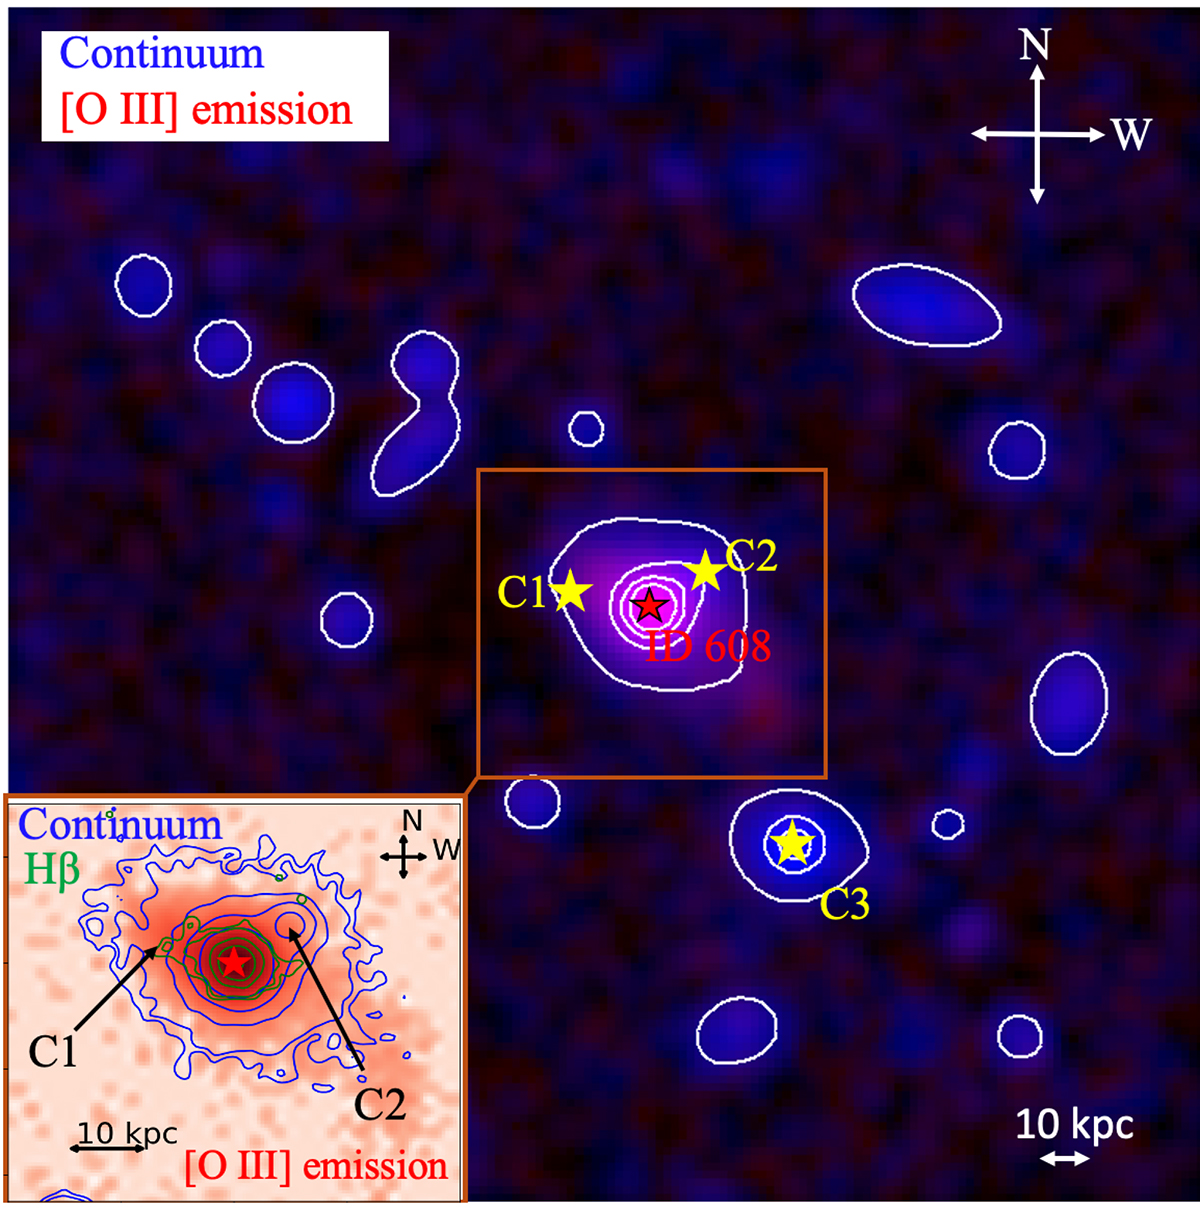
Fig. 4.
Download original image
Colour map of the continuum emission overlapped with the [O III] emission in 30″ × 30″ ≅ 201 × 201 kpc FOV. The continuum emission is shown in blue with corresponding white contours and the [O III] in red (no contours). The companion galaxies are marked by yellow stars, while ID 608 nucleus is marked by a red star. In the bottom left of this figure, we show the zoom-in map of the continuum (blue contours), [O III] (red without contours), and Hβ (green contours) emission. The positions of C1 and C2 are indicated that do not appear to emit in Hβ. The contours in the zoom in represent 3σ, 5σ, 15σ, 30σ, and 60σ.
Current usage metrics show cumulative count of Article Views (full-text article views including HTML views, PDF and ePub downloads, according to the available data) and Abstracts Views on Vision4Press platform.
Data correspond to usage on the plateform after 2015. The current usage metrics is available 48-96 hours after online publication and is updated daily on week days.
Initial download of the metrics may take a while.