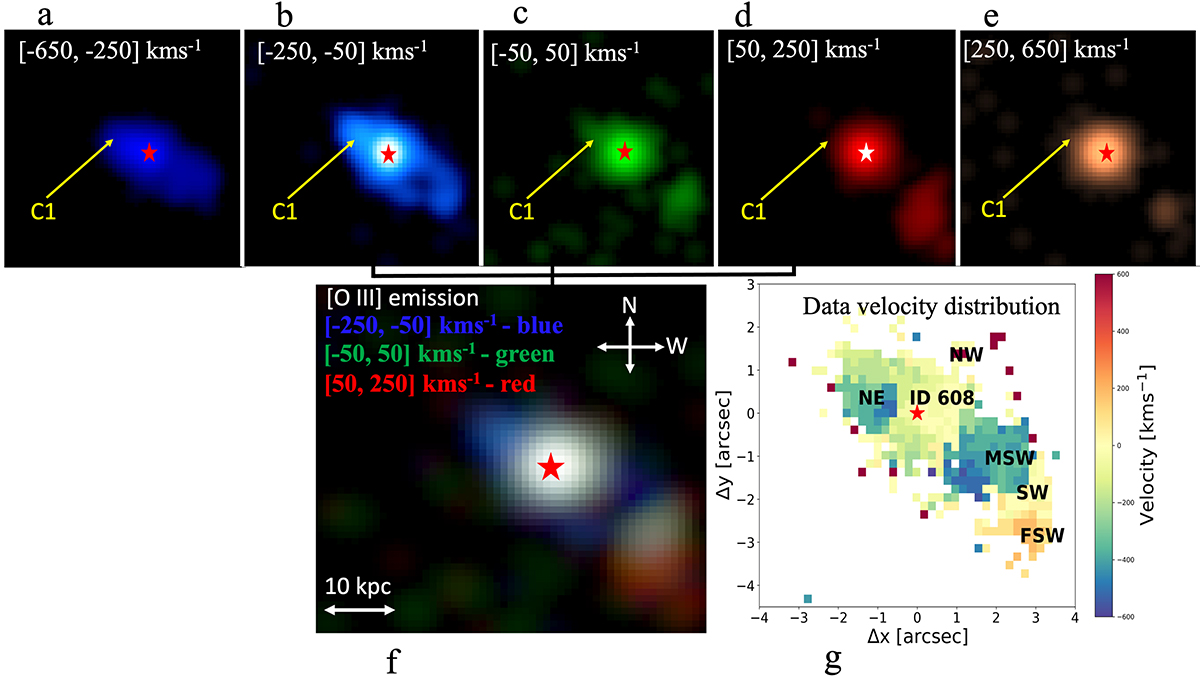
Fig. 2.
Download original image
RGB colour image, velocity channels and velocity distribution for the [O III] emission obtained from data without fitting. The different panels are named as a, b, c, d, e, f, and g. Panels a–e: [O III] intensity maps extracted in different velocity channels, as labelled. The arrows indicate the position of companion one (C1). Panel f: RGB colour image constructed from three [O III] velocity bins ([−250, −50] km s−1, [−50, −50] km s−1 and [50, 250] km s−1). Panel g shows the velocity distribution map attained without fitting to show the different regions as will be referred to in this study. The regions are NE, NW, SW, MSW, and FSW. The star shows the position of the nucleus of the quasar. The figures in all the panels are at the same scale and extracted from 8″ × 7.5″ ≅ 53 kpc × 50 kpc FOV.
Current usage metrics show cumulative count of Article Views (full-text article views including HTML views, PDF and ePub downloads, according to the available data) and Abstracts Views on Vision4Press platform.
Data correspond to usage on the plateform after 2015. The current usage metrics is available 48-96 hours after online publication and is updated daily on week days.
Initial download of the metrics may take a while.