Open Access
Fig. B.2.
Download original image
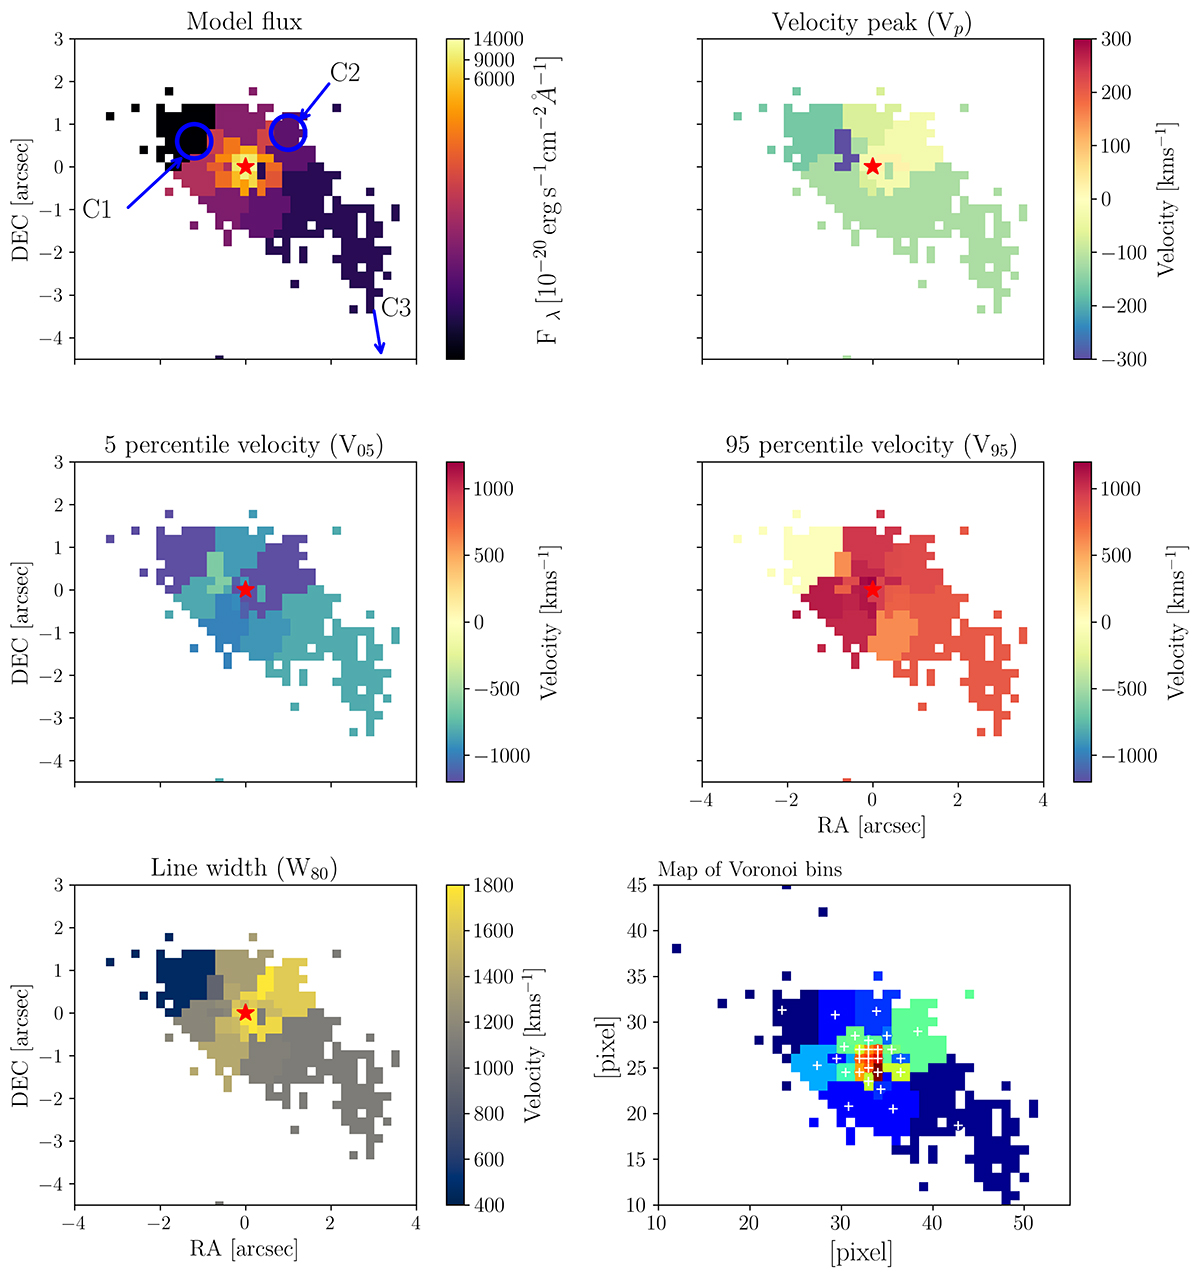
Results from three-Gaussian fitting of Voronoi bins. Top left panel: The flux map. Top right panel: the velocity peak. In the middle panel, we present the V05 and V95 maps indicating the velocities at the 5th and 95th percentile, respectively. Bottom left panel: The line width (W80). Bottom right panel: the Voronoi bins.
Current usage metrics show cumulative count of Article Views (full-text article views including HTML views, PDF and ePub downloads, according to the available data) and Abstracts Views on Vision4Press platform.
Data correspond to usage on the plateform after 2015. The current usage metrics is available 48-96 hours after online publication and is updated daily on week days.
Initial download of the metrics may take a while.