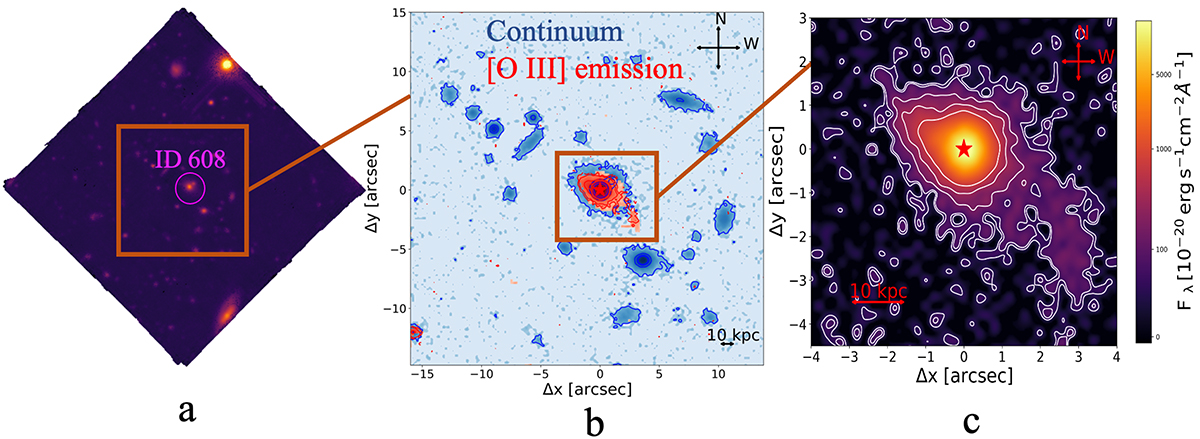
Fig. 1.
Download original image
Full data cube over the whole wavelength range covered in our MUSE observation and the continuum and [O III] emission for size-reduced cubes. Panel a (left) is the image of the full MUSE’s FOV (1′×1′≅402 kpc × 402 kpc) obtained after data reduction. ID 608 is marked by a purple circle. Panel b (centre) shows an inner zoom of the cube (30″ × 30″ ≅ 201 kpc × 201 kpc) with the continuum in blue, extracted from two regions of the spectrum (around [7825, 7900] Å and [8100, 8150] Å observed wavelengths) and the [O III] emission in red extracted from observed wavelengths 7890 Å to 8100 Å. Panel c (right) shows a further zoom (8″ × 7.5″ ≅ 53 kpc × 50 kpc) of the [O III] emission centred on the quasar position. The position of the nucleus of the quasar obtained from the maximum of the [OIII] emission is marked by the red star. The contours in both panels b and c represent 3σ, 5σ, 15σ, 30σ, and 60σ. North is up, East is left.
Current usage metrics show cumulative count of Article Views (full-text article views including HTML views, PDF and ePub downloads, according to the available data) and Abstracts Views on Vision4Press platform.
Data correspond to usage on the plateform after 2015. The current usage metrics is available 48-96 hours after online publication and is updated daily on week days.
Initial download of the metrics may take a while.