| Issue |
A&A
Volume 687, July 2024
|
|
|---|---|---|
| Article Number | A196 | |
| Number of page(s) | 12 | |
| Section | Astronomical instrumentation | |
| DOI | https://doi.org/10.1051/0004-6361/202449251 | |
| Published online | 12 July 2024 | |
A blind search for intraday gamma-ray transients with Fermi-LAT: Detections of GRB and solar emissions
1
GRAPPA, Anton Pannekoek Institute for Astronomy, University of Amsterdam,
Science Park 904,
1098
XH
Amsterdam,
The Netherlands
e-mail: This email address is being protected from spambots. You need JavaScript enabled to view it.
2
Institute of Physics, Academia Sinica,
Taipei
11529,
Taiwan
3
Academia Sinica Institute of Astronomy and Astrophysics,
11F of AS/NTU Astronomy-Mathematics Building, No. 1, Sec. 4, Roosevelt Rd.,
Taipei
10617,
Taiwan
4
Jodrell Bank Centre for Astrophysics, University of Manchester,
Manchester
M13 9PL,
UK
e-mail: This email address is being protected from spambots. You need JavaScript enabled to view it.
Received:
17
January
2024
Accepted:
19
April
2024
Abstract
We present a search for intraday transient γ-ray signals using 15.4 yr of the Fermi Large Area Telescope data. The search is based on a recently developed variable-size sliding-time-window (VSSTW) analysis and is aimed at studying variable γ-ray emission from gamma-ray bursts (GRBs) and the Sun. We refined the algorithm for searches for transient sources in order to solve the search problem within a reasonable amount of CPU time. These refinements allowed us to increase the number of gamma-ray bursts, solar flares, and quiescent solar events detected with the VSSTW technique by several times compared to the previous VSSTW search. The current search revealed a new γ-ray signal recorded with Fermi-LAT on 2018 January 12. This signal is probably from a GRB and deserves an exploration of the existing archival multiwavelength observations in order to identify it in an unambiguous way. We also report a γ-ray signal from the solar flare on 2023 December 31 that occurred during the 25th solar cycle.
Key words: methods: data analysis / catalogs / Sun: flares / Sun: X-rays, gamma rays / gamma rays: general
© The Authors 2024
 Open Access article, published by EDP Sciences, under the terms of the Creative Commons Attribution License (https://creativecommons.org/licenses/by/4.0), which permits unrestricted use, distribution, and reproduction in any medium, provided the original work is properly cited.
This article is published in open access under the Subscribe to Open model. This email address is being protected from spambots. You need JavaScript enabled to view it. to support open access publication.
1 Introduction
Transient sources are related to explosive and catastrophic events where very compact objects are involved and usually imply extreme astrophysical environments. The difference between a variable object and a transient object can be defined from the observational point of view on the detection limit of the instrument: a variable object remains detectable at any time, while a transient source does not. Owing to their serendipitous occurrence, time variability, and duration on different timescales, Akerlof et al. (2011) used a good phrase to describe searches for some unrepresentative γ-ray transients: not every fish can be caught with the same net. The term 'blind' (or unguided) used in the paper title emphasises that this type of search has no additional information about states beyond that provided in the problem definition. In the two previous papers (Prokhorov et al. 2021; Prokhorov & Moraghan 2023), we binned γ rays into time intervals of one week and performed temporal studies using this selection of intervals. In the Fermi All-sky Variability Analysis (FAVA; Ackermann et al. 2013a; Abdollahi et al. 2017), the authors also selected one-week time intervals. The one-week time intervals are basic to Fermi-LAT data as it is provided in weekly data files and are suitable for searches for transients lasting for several weeks and for short, but brighter transients. For instance, many γ-ray bursts (GRBs) last for less than a few hours, and if 6-h time intervals are used instead of one-week time intervals, the gain in a signal-to-noise ratio (S/N) compared to one-week time intervals for a short, hour-long γ-ray transient is ![Mathematical equation: $\[\sqrt{7 \times 24 / 6} \approx 5.3\]$](/articles/aa/full_html/2024/07/aa49251-24/aa49251-24-eq1.png) , where 7 × 24 and 6 correspond to the two intervals in units of hours. This gain is due to a smaller number of background γ rays hitting a γ-ray detector over a shorter period of time. Since the factor of 5.3 is fairly large, we can expect detections of short γ-ray transients at the signal level that remained below the detection thresholds in the previous blind searches for transients.
, where 7 × 24 and 6 correspond to the two intervals in units of hours. This gain is due to a smaller number of background γ rays hitting a γ-ray detector over a shorter period of time. Since the factor of 5.3 is fairly large, we can expect detections of short γ-ray transients at the signal level that remained below the detection thresholds in the previous blind searches for transients.
The PYTHON code, which employs a likelihood analysis to find the most statistically significant time interval of a high flux at a given position in the sky, developed by Prokhorov et al. (2021), is publicly available on Zenodo1 (for a review of likelihood theory, see Mattox et al. 1996). Following this approach, we performed a new search for transient γ-ray sources and, for this purpose, we compared a model with the presence of a temporary bright state above a steady flux level and a model assuming a source with a steady flux in time. In the previous papers, the variable-size sliding-time-window (VSSTW) approach was used particularly to identify bright γ-ray flux transient events each encompassing many consecutive weekly intervals. Here we used the VSSTW approach to find short transient events confined within single time intervals, such as most of the GRBs and solar emissions, and to distinguish these events from ubiquitous flares of active galactic nuclei (AGNs) which typically last for a longer time. The number of sliding window time intervals increases with a decreasing time step as ![Mathematical equation: $\[\boldsymbol{\mathcal{O}}(N^2)\]$](/articles/aa/full_html/2024/07/aa49251-24/aa49251-24-eq2.png) , where N is the total number of intervals. Therefore, the computing time increases quadratically and will be approximately (7 × 24/6)2 ≈ 1000 times longer, making such a search computationally expensive. Since the previous search by Prokhorov et al. (2021) took about 16000 CPU hours, we revised the algorithm in order to solve this search problem within a reasonable amount of CPU time.
, where N is the total number of intervals. Therefore, the computing time increases quadratically and will be approximately (7 × 24/6)2 ≈ 1000 times longer, making such a search computationally expensive. Since the previous search by Prokhorov et al. (2021) took about 16000 CPU hours, we revised the algorithm in order to solve this search problem within a reasonable amount of CPU time.
A total of 38 transient non-AGN γ-ray signals are present in the list obtained from a VSSTW analysis by Prokhorov et al. (2021). Among these signals, nine correspond to GRBs, three are solar flares, and two are solar events due to quiescent solar emission. In the VSSTW analysis, the Sun, which appears to move across the sky by about 1° per day, can be considered a γ-ray source moving along the ecliptic over the course of a year. The second Fermi-LAT GRB catalogue (Ajello et al. 2019) and the first Fermi-LAT solar flare catalogue (Ajello et al. 2021b) contain 186 GRBs and 45 solar flares, respectively. The large difference in numbers of GRBs and solar flares between the list obtained from the previous VSSTW analysis and these two catalogues are investigated in this paper by applying more sensitive techniques. A similar problem of increasing the number of binaries obtained from the VSSTW analysis was addressed by Prokhorov & Moraghan (2023), who included γ rays with lower energies and increased a number of test positions compared to the previous analysis. However, it is worth mentioning that blind searches are commonly less sensitive than searches that make use of multiwavelength information. The spatial and temporal characteristics of multiwavelength emission from transient sources are useful for detecting and identifying such signals in γ rays (see Akerlof et al. 2010, 2011; Rubtsov et al. 2012). On the one hand, the knowledge of this information leads to a small number of trials compared to blind searches and, in turn, to a higher detection significance. On the other hand, blind searches in the γ-ray band allow detections of signals, which for some reasons are missing or poorly spatially localised at other wavelengths.
We performed a new search in order to increase the number of transient γ-ray sources lasting for less than 6 h, in particular GRBs and solar flares, detected with the VSSTW method. The significant gain in S/N also enabled us to search for new transient γ-ray sources and visualise variations in the flux of γ rays from the Sun across one and a third solar cycles.
2 Spatiotemporal search method
In this section we provide an overview of the existing spatiotemporal search methods and describe a fast algorithm for a VSSTW search for short γ-ray transients.
2.1 Overview of spatiotemporal search methods
The Fermi Flare Advocate program, also known as Gamma-ray Sky Watcher (GSW), provides a quick look and review of the γ-ray sky observed daily by the Fermi-LAT through on-duty LAT Flare Advocates and high-level software pipelines such as the LAT Automatic Science Processing (ASP; Chiang 2007) and the Fermi All-sky Variability Analysis (Ackermann et al. 2013a). The GSW service provides rapid alerts and communicates to the scientific community potentially new γ-ray sources, remarkable transients, and flares. News items are regularly posted through Astronomer's Telegrams. However, not all Fermi-LAT transient events are reported through Astronomer's Telegrams by the Fermi-LAT team; for example, several high γ-ray states of Cygnus X-3 were reported by the AGILE team, but not by the Fermi-LAT team despite their detections both with AGILE and Fermi-LAT (see Prokhorov & Moraghan 2023). It is a case-by-case decision, made by on-duty LAT Flare Advocates, whether or not to report a transient or a flare through an Astronomer's Telegram. Moreover, the Fermi gamma-ray sky blog2 was actively maintained by on-duty LAT Flare Advocates from 2009 to 2017, but has since ceased operations.
The ASP analysis pipeline, which runs on the photon event and spacecraft data fits files, is composed of several scientific tasks (Chiang 2007). Among these are (i) blind search detection on all-sky photon counts maps accumulated in 6-h and one-day intervals, through a fast sky map scan method based on a two-dimensional Mexican Hat wavelet transform, thresholding, and sliding cell algorithms (Ciprini et al. 2007), and (ii) transient and flare identification based on a variability test. In this paper, we investigate the problem particularly related to these two tasks. To the best of our knowledge, the ASP analysis pipeline is available only within the Fermi-LAT team. The open source code for a VSSTW search creates new opportunities for members of the γ-ray astronomy community.
Temporal information plays a crucial role for identification of transient events. Most of the search pipelines for variable γ-ray emission from sources within the large region of the sky (Neronov et al. 2012; Ackermann et al. 2013a; Abdollahi et al. 2017; Baldini et al. 2021) on a timescale of weeks or months have one time variable that is the index of a time interval, which indicates where the high-flux state occurs. The VSSTW method (Prokhorov et al. 2021; Prokhorov & Moraghan 2023) has two time variables, namely the index of a time interval and the duration of a time interval. This second variable provides valuable information, for example for finding longer signals, such as high γ-ray flux states of the γ-ray binary LS I +61°303 present due to its superorbital period of 55 months. In addition, this variable can also be used to differentiate sources of a given class from the other sources on the basis of how long their γ-ray emission typically lasts. For most of the GRBs and solar flares, we expect that the γ-ray signals lie within one 6-h interval or at most two 6-h intervals (in the case of a GRB occurring near a boundary between two 6-h intervals).
Various methods for detecting point-like sources against the photon and instrumental background exist and are based on the search of local concentrations of γ rays. In addition to the traditional maximum likelihood algorithm (Mattox et al. 1996), other methods include the use of wavelet transform (Damiani et al. 1997; Ciprini et al. 2007), the density-based clustering algorithm DBSCAN (Tramacere & Vecchio 2013; Armstrong et al. 2015), and the minimum spanning tree algorithm (Campana et al. 2018). Although these methods permit searches for sources within each given time interval, the problem of how to associate a source detected in a particular time interval with a transient remains unresolved. To solve this problem, it is necessary to take temporal information into account. The VSSTW method, which takes both temporal information and spatial information into account, is an efficient computational framework for searches for γ-ray transients.
2.2 VSSTW search method for short transients
The VSSTW method was developed to search for the most statistically significant time interval of a high flux at a given position in the sky by taking temporal information into account. The time window has a size encompassing a whole number of time intervals and can start from the beginning of any of these time intervals. In this paper we show that the VSSTW method provides an efficient method of searching for short γ-ray transients.
The VSSTW method, written in PYTHON, uses data binned into spatial bins and into time bins. For spatial binning, the HEALPix package3 (Górski et al. 2005) provides a partition of the sky into equal-area pixels. As mentioned in Sect. 1, 6-h time bins are suitable for a search for short γ-ray transients in the Fermi-LAT data; however, this data binning requires a faster search algorithm than that used by Prokhorov & Moraghan (2023). With this time binning, there are about 20 thousand 6-h intervals. To accelerate the VSSTW search, we made three important changes.
First, instead of simultaneously opening 20 thousand of count maps and 20 thousand of exposure maps for reading the values for each spatial pixel, we simultaneously opened 1500 count maps and 1500 exposure maps and consequently repeated this process 16 times covering all the 20 thousand intervals. Each of these 16 slices approximately corresponds to 1 yr of data, except for the first slice and the last slice; all these slices are independent from each other with respect to a search for short γ-ray transients. This division helps us to significantly reduce the simultaneous memory (RAM) usage. It should be noted that the first of the 16 slices is shorter and contains 600 six-hour intervals from the start of the Fermi-LAT science operation in 2008 August to the end of 2008. Due to this choice, the second slice starts from the beginning of 2009, the third slice starts from the beginning of 2010, and so on. The 16th slice is also shorter and contains 944 six-hour intervals of the data accumulated between 2023 May and 2024 January.
For the second change we computed the flux summed over the energy bands used in this paper for each of the spatial pixels. Given that we searched for short γ-ray transients for each of the slices, containing 1500 six-hour intervals, we selected 400 six-hour intervals of the highest flux for every spatial pixel. We performed the VSSTW search within and around these selected intervals using them as 'seed intervals'. We note that these seed intervals are expectedly different for each spatial position.
For the third change, compared to the searches performed by Prokhorov et al. (2021) and Prokhorov & Moraghan (2023) which cover long transients, the time window can be significantly shortened when searching for short transients. We analysed data belonging to the four time windows starting from the beginning of a seed interval and ending within 24 h. Thus, the minimum duration of a time window is 6 h and the maximum duration of a time window is 24 h.
These three changes allowed us to significantly reduce the required CPU time and avoid the RAM overload. We utilised the equivalent of 512 cores on a cluster over a period of 72 h, resulting in approximately 37 000 core-hours of computational time.
We estimated the number of uncorrelated test spatial positions as 41 253/(π × 1.52) = 5836, where 41253 deg2 is a full sky area and the radius of 1°.5 is a radius of the PSF 68% containment at 0.5 GeV and minimises a position correlation of signals. We adapted a global significance level where we indicated the significance level after taking the 'look elsewhere effect' into account. This effect is quantified in terms of a trial factor that is the ratio of the probability of observing the excess in the obtained time interval to the probability of observing it with the same local significance level anywhere in the allowed range at any of the uncorrelated test positions (e.g. Prokhorov et al. 2021). For this search, we selected two criteria, named strong and weak. The strong criterion requires a global significance level above 5.0σ in one of the 1-yr slices. Given the trial factor, 5836 × 1500 = 8.75 × 10⁶, the global significance level for the strong criterion translates to a local significance level higher than 7.5σ. The weak criterion requires a global significance level above 3.0σ in any of the 1-yr slices. Given the trial factor, 5836 × 1500 × 15 = 1.31 × 10⁸, the global significance level for the weak criterion translates to a local significance level higher than 6.7σ.
In order to improve the sensitivity for sources whose flaring activity is at the edge of the time intervals, we shifted the data by 3-h and repeated the 6-h binned analysis.
3 Fermi-LAT data
The Fermi Large Area Telescope (LAT) is a pair-conversion γ-ray detector on board the Fermi Gamma-ray Space Telescope (FGST) spacecraft (Atwood et al. 2009). The FGST spacecraft was launched into an initial near-earth orbit of ≃565 km altitude at a 25.6 degree inclination with an eccentricity <0.01 on 2008 June 11. The Fermi orbital period is 96.5 min. Fermi's orbit keeps it close to the equator, but intersects the South Atlantic Anomaly region of intense background radiation. Fermi-LAT does not collect data when the spacecraft traverses the South Atlantic Anomaly (SAA), which occurs about ~15% of the time. The diameter of the Earth as seen from Fermi is ≃135°, so roughly 30% of the sky is occulted by the Earth at any one time. The field of view of Fermi-LAT covers ~20% of the sky at any instant and up to 75% of the sky every orbit. Fermi-LAT operates primarily in an all-sky scanning survey mode and has been scanning the sky continuously since 2008 August. Until 2018 March, the FGST spacecraft had rocked 50° north from the orbit plane for one orbit, and then 50° south from the orbit plane for the next orbit. The survey mode affords coverage of the entire sky every 3 h. Since 2018 March, the rocking profile enabling the LAT all-sky survey has been replaced with periods of various alternating rocking angles, but with minimal changes to the Fermi-LAT's long-term sky exposure (Ajello et al. 2021a). Given all these temporal scales, we chose 6-h time intervals, resulting in relatively uniform exposure, for a search for short γ-ray transients.
Fermi-LAT provides an angular resolution per single event of 5° at 0.1 GeV, 1.5° at 0.5 GeV, narrowing to 0.8° at 1 GeV, and further narrowing to 0.1° above 10 GeV. At energies below ~10 GeV, the reconstruction accuracy of γ-ray arrival directions is limited by multiple Coulomb scattering of electron-positron pair components in the heavy-metal converter foils of Fermi-LAT. As long as multiple scattering dominates, the point spread function (PSF) will have a 1/E dependence. Above ≈10 GeV, multiple scattering is unimportant and the accuracy is limited by the ratio of silicon-strip pitch to silicon-layer spacing. Given both the angular resolution dependence with energy and the broadband sensitivity to sources with power-law spectra4, we selected the optimal lower energy limit of 0.5 GeV. We made this selection with two purposes: to tighten the PSF and to include γ rays with energies down to 0.5 GeV, as was done by Prokhorov & Moraghan (2023) to increase the sensitivity for transient γ-ray sources with soft spectra, such as Cygnus X-3 (Fermi LAT Collaboration 2009) and PSR B1259-63 (Tam et al. 2011; H.E.S.S. Collaboration 2020). Gamma-ray emission due to the decay of neutral pions produced by >300 MeV protons and ions, with a power-law spectrum of index between 4 and 5, extending up to tens of GeV, produces a very good fit to the observed γ rays from solar flares (Ajello et al. 2021b). Thus, the lower energy limit introduced by Prokhorov & Moraghan (2023) into the code for a VSSTW search by Prokhorov et al. (2021) is well suited for a blind search for solar flares. Gamma rays above 10 GeV by contrast are detected by Fermi-LAT from GRBs, for example a 95 GeV photon from GRB 130427A and a 99 GeV photon from GRB 221009A (Ackermann et al. 2014; Pillera et al. 2022a), and also from the Sun during the solar minimum in 2008–2009 (e.g. six photons above 100 GeV reported by Linden et al. 2018). To include γ rays in the range of tens to hundreds of GeV, we selected the upper energy limit of 500 GeV.
We downloaded the Fermi-LAT Pass 8 (P8R3) SOURCE class (evtype=128) data, collected from 2008 August 4 to 2024 January 9, from the Fermi Science Support Center. The inclusion of 4 yr of additional data to the data set analysed by Prokhorov et al. (2021) allowed us to conduct a search for more recent γ-ray transients. We performed the data reduction and exposure calculations using the FERMITOOLS v1.2.23 package. We rejected γ rays with zenith angles larger than 90° to reduce contamination by albedo γ rays from the Earth and applied the recommended cuts on the data quality (DATA_QUAL> 0 && LAT_CONFIG== 1). We binned the data into time intervals of 6 h and in four energy bands: 0.5–0.8 GeV, 0.8–2.0 GeV, 2.0–5.0 GeV, and 5.0–500.0 GeV. We attributed one degree of freedom to every energy band when comparing a likelihood ratio test statistic to a χ2 distribution. Treatment of these four energy bands provided us with an analysis independent on the photon index and suitable both for GRBs with harder spectra and solar flares with softer spectra. We further binned the Fermi-LAT γ rays using the HEALPix package into a map of resolution Nside = 512 in Galactic coordinates with RING pixel ordering. With these settings, the total number of pixels is equal to 12 × 5122 = 3 145 728 and the area of each pixel is 4π × (180/π)2/(12 × 5122) = 0.0131 deg2, given the fact that HEALPix subdivides the sphere into 12 equal-area base pixels at the lowest resolution. To compute the exposure, we used the standard tools gtltcube and gtexpcube2, which are part of FERMITOOLS. To correct the livetime for the zenith angle cut, we used the 'zmax' option in gtltcube. For this analysis, we selected 196608 positions whose centres coincide with those of the HEALPix grid of resolution Nside = 128 in Galactic coordinates with RING pixel ordering. To search for transient signals at different positions on the sky, we grouped together γ rays within a 0°.5 distance from each of these 196608 positions. This distance is comparable to the HEALPix mean spacing, 0°.46, for Nside = 128. The high-resolution map with Nside = 512 resulted in more circular shapes for these groups. The 0°.5 radius aperture covers an area two times larger than the aperture used in Prokhorov et al. (2021). This increases the number of γ rays from the potential source, but is small enough to suppress contamination caused by the PSF wings of highly variable blazars or other neighbouring sources, especially in the two lowest energy bands.
4 Results
We present the results in Table 1, which contains the list of short γ-ray transients detected with the VSSTW search method, but excluding transients corresponding to quiescent solar emission or to AGNs. The names of transients are in the format FST YYMMDD5, where FST stands for Fermi-LAT short transient. We tabulated the global significance taking into account the trial factor for the weak detection criterion. The number of the detected GRBs and solar flares listed in this table is much higher than that previously reported by Prokhorov et al. (2021). If two or more signals belonging to neighbouring spatial pixels result in detections happening close in time, then we list the signal of the highest significance among them. In addition, we provided evidence for a new transient signal, which we tentatively associated with a GRB candidate, GRB 180112, and reported γ-ray emission from a new solar flare that occurred on 2023 December 31.
Figure 1 shows the local significance map for the ninth slice, based on the data between 2017-03 and 2018-03. The significance maps obtained from the VSSTW analysis applied to each of the analysed slices of data are publicly available in the fits format on Zenodo6.
To differentiate AGNs from other sources, we used both the spatial and temporal information. We classified a short transient as an AGN if it is located a distance of less than 0°.5 from any gamma-ray source identified or associated with AGNs in the fourth Fermi-LAT catalogue (4FGL; Abdollahi et al. 2020, 2022) and lasts for more than two consecutive 6-h intervals. In the 4FGL catalogue AGNs include mainly BL Lacertae objects, flat spectrum radio quasars, blazar candidates of uncertain type, and radio galaxies. Identifications, such as those used in the 4FGL catalogue, require a correlated flux variability observed at other wavelengths, while associations are positional coincidences that are statistically unlikely to be due to chance alignment between known and candidate γ-ray producing objects. We do not make a distinction between associations and identifications in this paper. The number of AGNs with detected flares, that fulfil the strong criterion, defined in Sec. 2.2, is 137. We found that 24% (76%) of these 137 AGNs are located near γ-ray sources identified as (associated with) an AGN in the 4FGL catalogue. We found that most of these identified or associated AGNs (82% and 69%, respectively) correspond to flat spectrum radio quasars. Several of these AGNs reveal multiple flares. The sample of AGNs showing at least 5 flares includes PKS 1510-089 (11 flares), 3C 454.3 (9 flares), CTA 102 (7 flares), 3C 279 (6 flares; see Fig. 1), PKS 1830-211 (5 flares), BL Lac (5 flares), and PKS 0903-57 (5 flares).
The total number of AGNs with detected flares, that fulfil either of the two criteria, defined in Sec. 2.2, is 178. Most of the detected flares (≃ 90%) from AGNs indeed last for more than two 6-h intervals and both these spatial and temporal conditions are satisfied, allowing easy association. However, there are AGN flares short enough to lie inside two 6-h intervals or even one 6-h interval. Among these shortest AGN flares are flares from PKS 1622-253, BL Lac, 1H 0323+342, PMN 2345-1555, S4 0954+65, 4C +31.03, CTA 102, PKS 0310+013, MG2 J071354+1934, 4C +38.41, PKS 2345-16, PKS 1313-333, and PKS 0501-36. All these shortest AGN-related transients have sky positions within a 0°.33 radius around AGN positions, allowing accurate association. This suggests that the approach for differentiating GRBs and solar events from AGN flares works well. In addition to AGNs, there is a short transient with a duration of two 6-h intervals in the direction of an unclassified 4FGL source, 4FGL J0809.8+0507. The other unclassified 4FGL sources detected in this VSSTW search are 4FGL J0009.2+6847 and 4FGL J1346.5+5330. By the time the most recent 4FGL-DR4 catalogue (Ballet et al. 2023) was released, our results had been finalised for the first 15 slices. In addition, we checked and found that among these three sources, 4FGL J0809.8-0507 is associated with an AGN (CRATES J080839+051459), 4FGL J0009.2+6847 is replaced with 4FGL J0008.4+6837 and is associated with an AGN (TXS 0005+683), and 4FGL J1346.5+5330 is associated with an AGN (1RXS J134545.1+533300) in the 4FGL-DR4 catalogue.
Below we describe non-AGN transient γ-ray sources detected with the VSSTW algorithm. The detected transients belong to different classes of sources, including GRBs, solar flares, novae, pulsar wind nebulae, and γ-ray binaries. In addition, there are numerous transient events due to the strong γ-ray emission from the quiescent Sun during the solar minimum as well as three unidentified sources present in the 4FGL catalogue. To identify non-AGN transient γ-ray sources, we used both their celestial coordinates and their flaring activity times. For GRBs and solar flares, we searched for counterparts in the second catalogue of LAT-detected GRBs (2FLGC; Ajello et al. 2019) and in the first Fermi-LAT solar flare (FLSF) catalogue (Ajello et al. 2021b), respectively. For quiescent solar emission, we compared the celestial coordinates of transients with the locations of the Sun, computed by means of the get_sun routine from the PYTHON module, astropy.coordinates7, at the given times.
Transient γ-ray signals obtained from the performed VSSTW analysis.
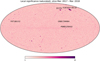 |
Fig. 1 Computed local significance map in σ. The scale is saturated at a statistical level of 8σ. The highest significance is 52σ for a solar flare, FLSF 17-09-10. The new transient reported in this paper, FST 180112, is shown in this figure along with a blazar, 3C 279; a γ-ray binary, PSR B1259-63; and GRB 170906A. |
4.1 GRBs
The first Fermi-LAT GRB catalogue was published in 2013 (1FLGC; Ackermann et al. 2013b). It is a compilation of the 35 GRBs: 30 long-duration (> 2 s) and 5 short-duration (< 2 s) GRBs, detected in the period 2008 August through 2011 July. Of these GRBs, 28 were detected with standard analysis techniques at energies above 100 MeV, while 7 GRBs were detected only < 100 MeV. The second catalogue of LAT-detected GRBs (2FLGC; Ajello et al. 2019), covering the first 10 yr of operations, from 2008 August 4 to 2018 August 4, has a total of 186 GRBs; of these, 169 are detected above 100 MeV. This ten-year catalogue includes 169 long GRBs and 17 short GRBs. During this time, the Fermi Gamma-ray Burst Monitor (GBM) triggered on 2357 GRBs, approximately half of which were in the field of view of the Fermi-LAT at the time of trigger. In the 1FLGC, the longest duration reported was >800 s for GRB 090902B. In the 2FLGC, many GRBs have durations of order 1000 s, with the longest duration being 35 ks (GRB 160623A). Thus, the choice of 6-h intervals is proper for a search for GRBs in Fermi-LAT data.
The list of GRBs detected by means of the previous VSSTW analysis and taken from Prokhorov et al. (2021) includes GRB 080916C, GRB 090510A, GRB 090926A, GRB 130427A, GRB 131231A, GRB 140206B, GRB 160623A, GRB 160625B, and GRB 171010A. The GRBs from this list are present in the 2FLGC catalogue. These nine GRBs have a high Fermi-LAT fluence in the 100 MeV-100 GeV energy range (see Table 4; Ajello et al. 2019). Among them, the highest fluence is (45 ± 4) × 10−5 erg cm−2 for GRB 130427A. The fluences of the other eight GRBs are (5.6 ± 0.8) × 10−5 erg cm−2 for GRB 080916C, (3.6 ± 0.6) × 10−5 erg cm−2 for GRB 090510A, (15 ± 2) × 10−5 erg cm−2 for GRB 090926A, (4 ± 2) × 10−5 erg cm−2 for GRB 131231A, (2.3 ± 0.6) × 10−5 erg cm−2 for GRB 140206B, (11 ± 3) × 10−5 erg cm−2 for GRB 160823A, (2.7 ± 0.3) × 10−5 erg cm−2 for GRB 160825B, and (1.1 ± 0.3) × 10−5 erg cm−2 for GRB 171010A. Although they are among the highest fluence GRBs, there are other GRBs with high fluences in Table 4 (see Ajello et al. 2019), including GRB 090902B ((9 ± 1) × 10−5 erg cm−2), GRB 090323 ((3.4 ± 0.9) × 10−5 erg cm−2), and GRB 150627A ((4 ± 0.1) × 10−5 erg cm−2). The presence of GRB 090902B in the 2FLGC catalogue, but not in the list from Prokhorov et al. (2021) was one of the motivations to perform a new VSSTW search using 6-h time intervals.
The VSSTW analysis presented in this paper resulted in detections of 37 GRBs. Among them, there are 30 GRBs that occurred between 2008 August 4 and 2020 January 30. Thus, the number of GRBs detected with a VSSTW technique increased more than three times compared with the previous search performed by Prokhorov et al. (2021). The nine GRBs listed in Prokhorov et al. (2021) are among the detected GRBs in this analysis. GRB 090902B, GRB 090323, and GRB 150627A are among the mentioned 30 GRBs. The fluences (Ajello et al. 2019) of 17 GRBs from the list obtained by removing the 9 GRBs reported in Prokhorov et al. (2021) along with GRB 090902B, GRB 090323, GRB 150627A, are mostly in the range of (1 × 10⁻⁵, 3 × 10⁻⁵) erg cm−2. However, the fluences of GRB 091003 and GRB 160509A are only (0.8 ± 0.2) × 10−5 erg cm−2 and (0.5 ± 0.3) × 10−5 erg cm−2, respectively. We note that these 2 GRBs are among the 10 GRBs (out of 37 GRBs) that satisfy the weak detection criterion, the other satisfy the strong detection criterion. Thus, this VSSTW analysis is sensitive to GRBs with lower fluences than those detected in the previous VSSTW analysis.
In addition to the GRBs from the 2FLGC catalogue, the VSSTW analysis resulted in detections of eight GRBs, which occurred between 2018 August 4 and 2024 January 9. These eight GRBs include GRB 181225A, GRB 211023A, GRB 220408B, GRB 220617A, GRB 220627A, GRB 221009A, GRB 221023A, and GRB 230812B. The first was revealed by an analysis of the data set with the 3-h shift. All eight of these GRBs had previously been reported in GRB Coordinates Network (GCN) circulars, #23561 (GRB 181225A; Arimoto et al. 2018) #30961 (GRB 211023A; Di Lalla et al. 2021), #31896 (GRB 220408B; Bissaldi et al. 2022), #32212 (GRB 220617A; Di Lalla et al. 2022), #32283 (GRB 220627A; di Lalla et al. 2022), #32658 (GRB 221009A; Pillera et al. 2022a), #32831 (GRB 221023A; Pillera et al. 2022b), and #34392 (GRB 230812B; Scotton et al. 2023).
4.2 GRB candidate: FST 180112
For the sake of robustness, we report new transient sources of GeV γ rays, which met the weak detection criterion in both the analysed samples based on the default binning and the one shifted in time by 3h. The term 'new' in this paragraph is applied to GeV γ-ray sources with unknown counterparts in the Fermi source catalogues or not yet reported via GCN circulars or other publications. This detection criterion allows us to eliminate possible spurious signals in disproportionally short exposure intervals and makes new transient sources reliable. The disproportionally short exposure intervals may arise due to the overlap between the 6-h binning and visibility of the source's position with Fermi-LAT. We checked and found that there is only a single event due to the disproportionally short exposure effect present in the sample shifted in time. That event occurred in 2021 November, and as it is based only on three γ rays, was discarded. The VSSTW analysis resulted in only one new transient source, satisfying the robustness criterion, in addition to the solar flare on 2023 December 31. This transient occurred on 2018 January 12 and its γ-ray emission is confined within one 6-h interval. The HEALPix pixel corresponding to this transient source has coordinates (RA, Dec)=(43.°83, 76.°52). Figure 2 shows a zoomed-in image of a local significance map centred on FST 180112.
To study the origin of the γ-ray emission that happened on 2018 January 12, we selected γ rays recorded by Fermi-LAT during the 6-h interval covering this transient. This selection revealed a cluster of five γ rays contributing to this transient event. All five of the γ rays are within a 0.°5 radius around the corresponding HEALPix pixel. The coordinates and arrival times of these γ rays are listed in Table 2. These five γ rays were recorded within a time interval of 11 min.
Given that the duration of FST 180112 is short, its position is more than 100° away from the Sun, it is 15° above the Galactic plane, and it is not associated with 4FGL sources, this transient is likely associated with either a GRB or an AGN flare. As we stated above, most of the AGN flares revealed with this VSSTW analysis have a duration longer than 6 h. Thus, FST 180112 is more likely associated with a GRB. We searched for a GRB that occurred on 2018 January 12 in the internet resources, including the SPI-ACS/INTEGRAL8, AstroSat CZTI9, Konus-Wind10, and CALET-GBM11 webpages. The source 'possible GRB 180112' was seen on 2018 January 12 with SPI-ACS/INTEGRAL at 16:30:39 UTC12, AstroSAT CZTI at 16:30:38 UTC13, Konus-Wind at 16:29:11 UTC14, and CALET-GBM at 16:29:08 UTC15. The light curves based on the Konus-Wind data and the CALET-GBM data look identical and show three separate peaks in the count rates, while the light curves based on the SPI-ACS/INTEGRAL data and the AstroSat data begin with the second peak. This explains the later start time of the transient recorded by SPI-ACS/INTEGRAL and AstroSat. The probability that FST 180112 and the event simultaneously observed with SPI-ACS/INTEGRAL, Konus-Wind, CALET-GBM, and AstroSat is a pure coincidence in time is about 1%, given the daily GRB detection rate recorded by these instruments. This probability is given by ≃fΔt, where f = 1/24 h−1 and the time interval between the signal detected by CALET-GBM and Fermi-LAT, Δt ~ 1000 s.
No corresponding signal is present in the Fermi GBM Burst Catalogue16 and the Fermi GBM Trigger Catalogue17. The FGST spacecraft was passing through the South Atlantic Anomaly from 16:09:40 UTC to 16:35:14 UTC on 2018 January 12. Thus, the Fermi GBM detectors were disabled and recorded no signal between 16:29:08 UTC and 16:30:39 UTC. The first of the five γ rays reported in Table 2 was recorded by Fermi-LAT on 16:42:21 UT.
A uniform all-sky Candidate Gamma-Ray Blazar Survey (CGRaBS) selected primarily by flat radio spectra was performed by Healey et al. (2008) to provide a large catalogue of likely gamma-ray AGNs suitable for identification of high-latitude γ-ray sources detected with Fermi-LAT. We found that the closest source in the CGRaBS catalogue to FST 180112 is CRBABs J0257+7843 and is located 2 degrees from the position of FST 180112, suggesting that the GRB nature of this transient is a good working hypothesis.
We encourage members of the GRB community to perform interplanetary network triangulation of the GRB candidate to localise the signal in space for comparison with the location of FST 180112 to identify its nature in an unambiguous way.
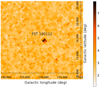 |
Fig. 2 Computed local significance map in σ centred on the position of FST 180112. |
Five γ rays associated with the new transient source, FST 180112.
4.3 Solar flares
The first FLSF catalogue covers the 24th solar cycle, which lasted from 2008 to 2019, and contains 45 solar flares with emission in the γ-ray energy band (30 MeV-10 GeV) detected with a significance >5σ over the years 2010–2018 (Ajello et al. 2021b). Thirty-seven of these flares exhibit delayed emission beyond the prompt-impulsive hard X-ray (HXR) phase with 21 flares showing delayed emission lasting more than 2 h, including the longest extended emission ever detected (20 h) from the FLSF 2012-03-07. This catalogue includes three flares originating from active regions located behind the limb of the visible solar disk. The analysis by Ajello et al. (2021b) indicates that the solar flare emission above 100 MeV is due to accelerated ions as opposed to HXRs and microwave producing electrons. Two main populations of FLSFs are impulsive-prompt and gradual-delayed. The impulsive-prompt flares are those whose emission evolution is similar to that of the HXRs, while the emission of delayed FLSF flares rises at the end of the impulsive HXR phase and extends well beyond the end of the HXR emission.
The list of solar flares from Prokhorov et al. (2021) includes three flares on 2012 March 7, 2014 September 1, and 2017 September 10. These three solar flares are present in the FLSF catalogue. These three solar flares have the highest Fermi-LAT fluence above 100 MeV among all the solar flares reported in the FLSF catalogue (see Table 1; Ajello et al. 2021b). Their photon fluences are 33.996 ± 0.030 cm−2 for FLSF 2012-03-07, 12.1 ± 2.3 cm−2 for FLSF 2014-09-01, and 22.2 ± 1.6 cm−2 for FLSF 2017-09-10. Another solar flare with such a high fluence from the FLSF catalogue is FLSF 2014-02-25 (13.95 ± 0.18 cm−2). The fluence of FLSF 2014-02-25 is as high as that of FLSF 2014-09-01, but the former was not revealed with the previous VSSTW analysis. Apart from these four solar flares with the highest fluence, the other solar flares from the FLSF catalogue have significantly lower fluences. Thus, the solar flares with the fifth and sixth highest fluences are FLSF 2011-03-07 (1.076 ± 0.029 cm−2) and FLSF 2017-09-06b (1.0700 ± 0.0022 cm−2). One of the goals of the VSSTW analysis in this paper is to detect solar flares with significantly lower fluences than those of the three solar flares from Prokhorov et al. (2021).
The VSSTW analysis in this paper resulted in detections of eight solar flares during the 24th solar cycle, including FLSF 2011-03-07, FLSF 2011-09-06, FLSF 2012-03-07, FLSF 2012-07-06, FLSF 2013-10-11, FLSF 2014-02-25, FLSF 2014-09-01, and FLSF 2017-09-10. Thus, the number of solar flares during the 24th solar cycle detected with a VSSTW technique increased more than 2.5 times compared with the previous search performed by Prokhorov et al. (2021). In addition to the three solar flares with the highest fluence from Prokhorov et al. (2021), the VSSTW analysis also revealed two more solar flares, namely FLSF 2014-02-25 and FLSF 2011-03-07, with fluences higher than 1 cm−2. The other three detected flares, FLSF 2011-09-06, FLSF 2012-07-06, and FLSF 2013-10-11, have fluences of 0.87 ± 0.17 cm−2, 0.100 ± 0.021 cm−2, and 0.262 ± 0.013 cm−2, respectively (Ajello et al. 2021b). Thus, the VSSTW analysis presented in this paper allowed us to lower a fluence for solar flares detected by means a VSSTW technique from 10 cm−2 to below 1 cm−2.
In addition to the solar flares from Ajello et al. (2021b), the present VSSTW analysis resulted in a detection of γ-ray emission from a solar flare on 2023 December 31. The signal based on the VSSTW analysis occurred on 2023 December 31 and its γ-ray emission is confined within two 6-h intervals. The HEALPix pixel corresponding to this transient source has coordinates (R.A., Dec)=(280.°86, −23° 18). Figure 3 shows a local significance map centred on this position. The corresponding solar flare occurred during the 25th solar cycle that started in 2019 and was classified as an X5.0 flare18. It is the largest flare since September 10, 2017 when an X8.2 flare occurred.
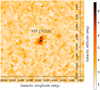 |
Fig. 3 Computed local significance map in σ centred on the position of FST 231231, corresponding to the solar flare on 2023 December 31. |
4.4 Quiescent solar emission
The detection of high-energy γ rays from the quiescent Sun with Fermi-LAT was made during the period of low solar activity when the emission induced by cosmic rays is brightest (Abdo et al. 2011). Because the Sun is moving across the sky, the Sun leaves behind a track on the γ-ray sky map (see Fig. 1 in Barbiellini et al. 2014). The highly significant detection allowed clear separation of the two components: the point-like emission from the solar disk due to cosmic-ray cascades in the solar atmosphere, and the extended emission from the inverse Compton scattering of cosmic-ray electrons on solar photons in the heliosphere. The fluxes of both these emission components must change over the solar cycle due to the change in the heliospheric flux of the Galactic cosmic rays in anti-correlation with the variations of the solar activity. The significant time variation of the γ-ray flux from the solar disk that anti-correlates with solar activity was indeed detected in the Fermi-LAT data (Ng et al. 2016; Linden et al. 2022). The Sun-centred maps were used in the analyses by Ng et al. (2016) and Linden et al. (2022) to study solar flux variations.
The list of transients from Prokhorov et al. (2021) includes only two signals corresponding to the quiescent Sun in 2009 July and 2019 October. In addition to these two transients, they reported a transient signal from the Sun on 2013 February 8. A similar solar transient in 2013 February was later reported in Table 2 of Baldini et al. (2021). In addition to this transient, Baldini et al. (2021) reported 34 transients occurred between 2008 August and 2018 August, and is associated with the quiescent emission from the moving Sun. These 34 transients are shown in Table 2 and Fig. 3 in Baldini et al. (2021); 23 of these 34 transients occurred before 2011 March and the 8 most recent of these transients occurred in 2017.
The solar track is clearly visible in the significance map shown in Fig. 1. This significance map is for the ninth slice, which corresponds to the data taken between 2017 March and 2018 March. This track of the Sun is called the ecliptic. The Sun moves eastwards on the celestial sphere and completes one full circle of 360° over 1 yr. Solar flare FLSF 2017-09-10 and Blazar 3C 279 are noticeable on the solar track. Blazar 3C 279 is occulted by the Sun on 8 October every year. The solar track in Fig. 1 covers a large number of pixels in the sky. This number is much larger than 3, which represents the transients corresponding to the quiescent solar emission detected from 2017 March to 2018 March and shown in Table 1. However, most of these pixels do not meet the weak detection criterion. The detected transients corresponding to the quiescent solar emission are most likely upward fluctuations of the γ-ray flux from the solar disk.
The VSSTW analysis presented in this paper resulted in detections of 35 transients associated with the quiescent emission from the solar disk. Consequently, this allowed for the detection of approximately 20 times more transients related to the quiescent γ-ray emission from the solar disk than in the previous VSSTW analysis. Twenty of these 35 solar transients were in 2008–2010, of which 16 were between 2008 August and 2009 September. Different sky-survey profiles have been used on Fermi19, and the on-source exposure also varies in time because of the use of different sky-survey profiles. The original rocking profile was 35 degrees north (relative to the local zenith) for one orbit, then 35 degrees south for one orbit. Due to spacecraft thermal considerations Fermi gradually increased the rocking angle until settling on a rocking angle of 50 degrees in 2009 September. The difference in rocking profile is the reason why the number of transients associated with the solar quiescent emission is higher between 2008 August and 2009 September in the beginning of the 24th solar cycle. Four of these 16 transients that occurred before 2009 September are the only ones of the total 35 transients that satisfy the strong detection criterion. Solar activity was minimal until early 2010 and reached its maximum in 2014 April. The number of solar flares, including M5-M9 and X1-X5, per year was high in 2011–2015 (e.g. Fig. 20 of Ajello et al. 2021b). Only two transients associated with the solar quiescent emission were detected with the VSSTW analysis between 2011 and 2015. Between 2016 and 2020, the sunspot number was decreasing and the number of transients associated with the solar quiescent emission between 2016 and 2020 was 13. It may indicate that the change in the rate of transients between 2011–2015 and 2016–2020 is associated with quiescent solar emission and is in anti-correlation with the variations of the solar activity.
4.5 Other transient sources
In addition to GRBs, solar flares, quiescent solar events, and blazars, there are sources of other classes detected in this VSSTW search. Most of these transients are novae, including V407 Cygni, V5856 Sagittarii, V906 Carinae, YZ Reticuli, and RS Ophiuchi. The VSSTW analysis shows that the duration of these transients is longer than three 6-h intervals. This behaviour is similar to that of blazars and should be interpreted that these transients last for significantly longer intervals than those tested in this paper. It is known that γ-ray emission from novae usually lasts for two weeks (e.g. Abdo et al. 2010; Franckowiak et al. 2018). The limit of maximum possible duration, used here, thus divides the γ-ray emission signal from novae into two parts. The longest of these parts will contribute to the background, but given that the background is computed from the 1-yr interval, this contribution will be too small to substantially increase the background level. Three novae, V407 Cygni, V5856 Sagittarii, and V906 Carinae, are present in the list from Prokhorov et al. (2021) at high significance levels. As for YZ Reticuli, and RS Ophiuchi, they are more recent novae and occurred in 2020 July and 2021 August, respectively. YZ Reticuli is at a high Galactic latitude (Baldini et al. 2021) and RS Ophiuchi is the brightest Fermi-LAT nova (Cheung et al. 2022). The higher significances of transient emissions from RS Ophiuchi and V906 Carinae, which are 19.1σ and 14.3σ, are due to the fact that these two novae are brighter in γ rays than the other three novae (Cheung et al. 2022).
Apart from novae, the VSSTW analysis shows transient γ-ray emission from the Crab nebula and the γ-ray binary, PSR B1259-63. The transient γ-ray emission from the Crab nebula is at a significance level of 21.8σ and corresponds to the exceptional flare of 2011 April (Buehler et al. 2012). In the previous VSSTW analysis (Prokhorov et al. 2021), this exceptional flare lasted for about one week (Buehler et al. 2012; Prokhorov et al. 2021), its detection in this analysis is explained in the same way as the five novae mentioned above. As for the γ-ray binary, PSR B1259-63, which has an orbital period of 1237 days, its high-gamma;-ray-flux state started in 2011 January, 2017 October, and 2021 March, following the periastron passages (e.g. Prokhorov & Moraghan 2023). The transient signal from PSR B1259-63, detected with this VSSTW analysis, occurred in 2017 November 17 following the periastron passage on 2017 September 22 and lasted less than 6 h (see Fig. 1). It agrees with the fact that the maximum one-day flux level was 56 days after the periastron passage (Johnson et al. 2018). Excluding GRBs and solar flares, this flare from PSR B1259-63 is the fastest GeV variability observed in LAT data (Johnson et al. 2018), and thus the short duration of this flare is expected.
5 Discussion: FST 180112
In order to clarify whether the presence of five counts near position of FST 180112 recorded in 11 min is an ordinary or extraordinary transient event, we performed an additional analysis using a clustering algorithm. The data set analysed here includes the first 814 weeks of Fermi-LAT data and had been recorded between 2008 August 4 and 2024 January 9. Similarly to the VSSTW analysis, we selected γ rays above 0.5 GeV. Given that the number of diffuse γ rays is high near the Galactic plane, we removed all the γ-ray events between −2° and +2° Galactic latitudes. We also excluded the clusters if the tested count is within 1° of a 4FGL γ-ray source. The goal of this additional analysis is to search for sets of five counts with a distance not exceeding a given value. For this purpose, we used the PYTHON module, sklearn.neighbors20 and a nearest neighbours algorithm, KDTree. For this clustering analysis, we selected a 'Manhattan' distance, which is a sum of absolute values. In contrast with the clustering algorithms mentioned in Sect. 2.1, we introduce two spatial coordinates and one time coordinate. The first spatial coordinate is declination, Dec, and the second spatial coordinate is RA × cos ((π/180) × Dec), where RA is right ascension. The time coordinate is time measured in seconds and further divided by 600. Thus, one degree of distance approximately corresponds 10 min of time. Both these spatial coordinates are in units of degrees. The selected Manhattan distance is a compromise between the Euclidean distance between two points given their spatial coordinates and the linear distance between two points in time. The Manhattan distance is larger than the Euclidean distance, at most by ![Mathematical equation: $\[\sqrt{2}\]$](/articles/aa/full_html/2024/07/aa49251-24/aa49251-24-eq3.png) , and is a reasonable proxy for estimating a spatiotemporal distance. After finding the spatiotemporal clusters of γ rays, we identify them with known γ-ray sources using the temporal and spatial information.
, and is a reasonable proxy for estimating a spatiotemporal distance. After finding the spatiotemporal clusters of γ rays, we identify them with known γ-ray sources using the temporal and spatial information.
We list the spatiotemporal clusters of five γ rays with distances sorted in ascending order and the γ-ray sources identified with these clusters in Table 3. We terminated the cluster analysis when it encountered an AGN flare, which was from PKS 0903-57 and reported in the Astronomer's Telegram #13604 (Buson 2020).
There are six GRBs and one FLSF corresponding to clusters of five γ rays with distances of less than 0.89, but not revealed with the VSSTW analysis: GRB 100116A, GRB 110731A, FLSF 2012-06-03, GRB 131108, GRB 140402A, GRB 160509A, and GRB 190531B. On the other hand, there are 12 GRBs and three FLSFs detected with the VSSTW analysis, but not revealed with the cluster analysis: GRB 091003, GRB 090323, FLSF 2011-03-07, FLSF 2012-07-07, GRB 130821A, GRB 140810A, GRB 140928A, GRB 150523A, GRB 150627A, GRB 160623A, GRB 170906A (see Fig. 1), GRB 171010A, GRB 180210A, GRB 211023A, and the solar flare on 2023-12-31. Although the statistical significance of each of the clusters of five γ rays is not determined, the fact that all the clusters with distances less than that for FST 180112 are identified with known GRBs, FLSFs, and the nova RS Ophiuchi implies that the result obtained from the cluster analysis is reliable. Given that FST 180112 has the smallest distance for not-yet-identified signals present in the cluster analysis, this transient source deserves an exploration of existing archival multiwavelength observations.
The fact that four missions, namely INTEGRAL, AstroSat, Konus-Wind, and CALET, detected a strong GRB (see Sec. 4.2) just 1000 s before the cluster of GeV γ rays suggests that FST 180112 is GRB high-energy afterglow emission as usually detected by Fermi-LAT.
Gamma-ray sources identified with spatiotemporal clusters of five γ rays with distances sorted in ascending order.
6 Outlook
This paper confirms the validity of our previous work and the reliability of the VSSTW technique. The presented VSSTW analysis inherited the energy range, the 0.°5 radius aperture, and the SOURCE event class from the previous analysis by Prokhorov & Moraghan (2023). This inheritance was necessary here for a direct comparison of the current and previous results. There is room for some further exploration of γ-ray transients by means of the VSSTW technique for enabling searches on time intervals much shorter than 6 h. The selection of larger data sets can also be useful. To extend the energy range down to the nominal Fermi-LAT energy boundary, 100 MeV, for the inclusion of more γ rays from GRBs and solar flares, the constant aperture may be changed to an energy-dependent aperture compensating for the increase of the Fermi-LAT PSF at low energies. A segmented aperture with radial weights may also be useful to better approximate the PSF. For analyses of timescales <200 s that benefit from increased photon statistics while tolerating a higher background fraction and broader PSF, the TRANSIENT event class is a good choice and is recommended by the Fermi-LAT team. Our open source code for a VSSTW search is available on Zenodo and provides members of the γ-ray astronomy community with a tool for future detections of transients.
7 Summary
We performed a VSSTW analysis with the purpose of searching for transient γ-ray signals in the Fermi-LAT data. Compared to the previous searches by means of this technique by Prokhorov et al. (2021) and Prokhorov & Moraghan (2023), we used 6-h time intervals instead of seven-day time intervals. The use of shorter time intervals increased the signal-to-noise ratio and allowed more detections of GRBs and solar flares. The detected transient sources, including GRBs and solar flares, are listed in Table 1. This refined search increased the number of short transient γ-ray sources, such as GRBs and solar flares, by a factor of 3 compared to the number reported in the search previously published by Prokhorov et al. (2021). Based on this analysis, we reported for the first time a γ-ray signal from the solar flare that occurred on 2023 December 31 during the 25th solar cycle. In addition, the performed VSSTW analysis resulted in detections of 37 transient signals associated with the quiescent emission from the solar disk. The distribution of these 37 signals indicates the presence of the solar modulation of Galactic cosmic rays. All these show the efficiency of the VSSTW technique for blind searches for intraday γ-ray transients.
In addition to GRBs and transients due to the solar emission, the VSSTW search revealed a number of AGN flares and novae as well as one γ-ray binary, PSR B1259-63, and the exceptional flare from the Crab nebula. Most of the intraday γ-ray transients detected with this blind search are identified with known transient sources mainly detected with the analyses that make use of multiwavelength information. Meanwhile, we reported a new transient signal, FST 180112, recorded with Fermi-LAT on 2018 January 12. This transient signal includes a cluster of five γ rays that all arrived within 11 min. This γ-ray transient is probably from a GRB, given its duration and also the presence of a simultaneous lower energy signal detected with SPI-ACS/INTEGRAL, Konus-Wind, CALET-GBM, and AstroSat. FST 180112, revealed with the VSSTW analysis, shows that this technique allows new detections of sources in the archival data although this technique is commonly less sensitive than the traditional (non-blinded) analyses given a trial factor. All the transient signals found by means of this VSSTW analysis have source associations.
Acknowledgements
We are grateful to the referee for the constructive comments that helped us to improve the manuscript. We acknowledge access to high-performance facilities (TIARA cluster and storage) in ASIAA, and the computational facilities of the ALMA Regional Center Taiwan, Academia Sinica, Taiwan.
References
- Abdo, A. A., Ackermann, M., Ajello, M., et al. 2010, Science, 329, 817 [NASA ADS] [CrossRef] [Google Scholar]
- Abdo, A. A., Ackermann, M., Ajello, M., et al. 2011, ApJ, 734, 116 [NASA ADS] [CrossRef] [Google Scholar]
- Abdollahi, S., Ackermann, M., Ajello, M., et al. 2017, ApJ, 846, 34 [NASA ADS] [CrossRef] [Google Scholar]
- Abdollahi, S., Acero, F., Ackermann, M., et al. 2020, ApJS, 247, 33 [Google Scholar]
- Abdollahi, S., Acero, F., Baldini, L., et al. 2022, ApJS, 260, 53 [NASA ADS] [CrossRef] [Google Scholar]
- Ackermann, M., Ajello, M., Albert, A., et al. 2013a, ApJ, 771, 57 [NASA ADS] [CrossRef] [Google Scholar]
- Ackermann, M., Ajello, M., Asano, K., et al. 2013b, ApJS, 209, 11 [NASA ADS] [CrossRef] [Google Scholar]
- Ackermann, M., Ajello, M., Asano, K., et al. 2014, Science, 343, 42 [NASA ADS] [CrossRef] [Google Scholar]
- Ajello, M., Arimoto, M., Axelsson, M., et al. 2019, ApJ, 878, 52 [NASA ADS] [CrossRef] [Google Scholar]
- Ajello, M., Atwood, W. B., Axelsson, M., et al. 2021a, ApJS, 256, 12 [NASA ADS] [CrossRef] [Google Scholar]
- Ajello, M., Baldini, L., Bastieri, D., et al. 2021b, ApJS, 252, 13 [NASA ADS] [CrossRef] [Google Scholar]
- Akerlof, C. W., Zheng, W., Pandey, S. B., & McKay, T. A. 2010, ApJ, 725, L15 [NASA ADS] [CrossRef] [Google Scholar]
- Akerlof, C. W., Zheng, W., Pandey, S. B., & McKay, T. A. 2011, ApJ, 726, 22 [NASA ADS] [CrossRef] [Google Scholar]
- Arimoto, M., Palatiello, M., Longo, F., et al. 2018, GRB Coordinates Network, 23561, 1 [NASA ADS] [Google Scholar]
- Armstrong, T., Brown, A. M., Chadwick, P. M., & Nolan, S. J. 2015, MNRAS, 452, 3159 [NASA ADS] [CrossRef] [Google Scholar]
- Atwood, W. B., Abdo, A. A., Ackermann, M., et al. 2009, ApJ, 697, 1071 [CrossRef] [Google Scholar]
- Baldini, L., Ballet, J., Bastieri, D., et al. 2021, ApJS, 256, 13 [NASA ADS] [CrossRef] [Google Scholar]
- Ballet, J., Bruel, P., Burnett, T. H., Lott, B., & The Fermi-LAT Collaboration 2023, arXiv e-prints [arXiv:2307.12546] [Google Scholar]
- Barbiellini, G., Bastieri, D., Bechtol, K., et al. 2014, ApJ, 784, 118 [NASA ADS] [CrossRef] [Google Scholar]
- Bissaldi, E., Arimoto, M., Ciprini, S., et al. 2022, GRB Coordinates Network, 31896, 1 [NASA ADS] [Google Scholar]
- Buehler, R., Scargle, J. D., Blandford, R. D., et al. 2012, ApJ, 749, 26 [NASA ADS] [CrossRef] [Google Scholar]
- Buson, S. 2020, ATel, 13604, 1 [NASA ADS] [Google Scholar]
- Campana, R., Massaro, E., & Bernieri, E. 2018, A&A, 619, A23 [NASA ADS] [CrossRef] [EDP Sciences] [Google Scholar]
- Cheung, C. C., Johnson, T. J., Jean, P., et al. 2022, ApJ, 935, 44 [NASA ADS] [CrossRef] [Google Scholar]
- Chiang, J. 2007, in Gamma-Ray Bursts: Prospects for GLAST, eds. M. Axelsson, & F. Ryde, AIP Conf. Ser., 906, 11 [NASA ADS] [CrossRef] [Google Scholar]
- Ciprini, S., Tosti, G., Marcucci, F., et al. 2007, in The First GLAST Symposium, eds. S. Ritz, P. Michelson, & C. A. Meegan, AIP Conf. Ser., 921, 546 [NASA ADS] [CrossRef] [Google Scholar]
- Damiani, F., Maggio, A., Micela, G., & Sciortino, S. 1997, ApJ, 483, 350 [NASA ADS] [CrossRef] [Google Scholar]
- Di Lalla, N., Longo, F., Ohno, M., & Fermi-LAT Collaboration 2021, GRB Coordinates Network, 30961, 1 [NASA ADS] [Google Scholar]
- Di Lalla, N., Arimoto, M., Axelsson, M., Principe, G., & Fermi-LAT Team 2022, GRB Coordinates Network, 32212, 1 [NASA ADS] [Google Scholar]
- di Lalla, N., Axelsson, M., Arimoto, M., Omodei, N., & Crnogoreeviae, M. 2022, GRB Coordinates Network, 32283, 1 [NASA ADS] [Google Scholar]
- Fermi LAT Collaboration (Abdo, A. A., et al.) 2009, Science, 326, 1512 [CrossRef] [PubMed] [Google Scholar]
- Franckowiak, A., Jean, P., Wood, M., Cheung, C. C., & Buson, S. 2018, A&A, 609, A120 [NASA ADS] [CrossRef] [EDP Sciences] [Google Scholar]
- Górski, K. M., Hivon, E., Banday, A. J., et al. 2005, ApJ, 622, 759 [Google Scholar]
- H.E.S.S. Collaboration (Abdalla, H., et al.) 2020, A&A, 633, A102 [NASA ADS] [CrossRef] [EDP Sciences] [Google Scholar]
- Healey, S. E., Romani, R. W., Cotter, G., et al. 2008, ApJS, 175, 97 [Google Scholar]
- Johnson, T. J., Wood, K. S., Kerr, M., et al. 2018, ApJ, 863, 27 [Google Scholar]
- Linden, T., Zhou, B., Beacom, J. F., et al. 2018, Phys. Rev. Lett., 121, 131103 [NASA ADS] [CrossRef] [Google Scholar]
- Linden, T., Beacom, J. F., Peter, A. H. G., et al. 2022, Phys. Rev. D., 105, 063013 [CrossRef] [Google Scholar]
- Mattox, J. R., Bertsch, D. L., Chiang, J., et al. 1996, ApJ, 461, 396 [Google Scholar]
- Neronov, A., Malyshev, D., Chernyakova, M., & Lutovinov, A. 2012, A&A, 543, L9 [NASA ADS] [CrossRef] [EDP Sciences] [Google Scholar]
- Ng, K. C. Y., Beacom, J. F., Peter, A. H. G., & Rott, C. 2016, Phys. Rev. D., 94, 023004 [CrossRef] [Google Scholar]
- Pillera, R., Bissaldi, E., Omodei, N., et al. 2022a, GRB Coordinates Network, 32658, 1 [NASA ADS] [Google Scholar]
- Pillera, R., Cutini, S., Maheso, D., et al. 2022b, GRB Coordinates Network, 32831, 1 [NASA ADS] [Google Scholar]
- Prokhorov, D. A., & Moraghan, A. 2023, MNRAS, 519, 2680 [Google Scholar]
- Prokhorov, D. A., Moraghan, A., & Vink, J. 2021, MNRAS, 505, 1413 [NASA ADS] [CrossRef] [Google Scholar]
- Rubtsov, G. I., Pshirkov, M. S., & Tinyakov, P. G. 2012, MNRAS, 421, L14 [NASA ADS] [Google Scholar]
- Scotton, L., Kocevski, D., Racusin, J., Omodei, N., & Fermi-LAT Collaboration 2023, GRB Coordinates Network, 34392, 1 [NASA ADS] [Google Scholar]
- Tam, P. H. T., Huang, R. H. H., Takata, J., et al. 2011, ApJ, 736, L10 [NASA ADS] [CrossRef] [Google Scholar]
- Tramacere, A., & Vecchio, C. 2013, A&A, 549, A138 [NASA ADS] [CrossRef] [EDP Sciences] [Google Scholar]
Due to the choice of 6-h time intervals, transients that happened near midnight in UTC, including, for example, GRB 080916C, FLSF 2012-03-07, FLSF 2014-02-25, and GRB 170916A, can have different dates in their FST identifier and associated source name.
All Tables
Gamma-ray sources identified with spatiotemporal clusters of five γ rays with distances sorted in ascending order.
All Figures
|
Fig. 1 Computed local significance map in σ. The scale is saturated at a statistical level of 8σ. The highest significance is 52σ for a solar flare, FLSF 17-09-10. The new transient reported in this paper, FST 180112, is shown in this figure along with a blazar, 3C 279; a γ-ray binary, PSR B1259-63; and GRB 170906A. |
| In the text | |
|
Fig. 2 Computed local significance map in σ centred on the position of FST 180112. |
| In the text | |
|
Fig. 3 Computed local significance map in σ centred on the position of FST 231231, corresponding to the solar flare on 2023 December 31. |
| In the text | |
Current usage metrics show cumulative count of Article Views (full-text article views including HTML views, PDF and ePub downloads, according to the available data) and Abstracts Views on Vision4Press platform.
Data correspond to usage on the plateform after 2015. The current usage metrics is available 48-96 hours after online publication and is updated daily on week days.
Initial download of the metrics may take a while.