Fig. 9.
Download original image
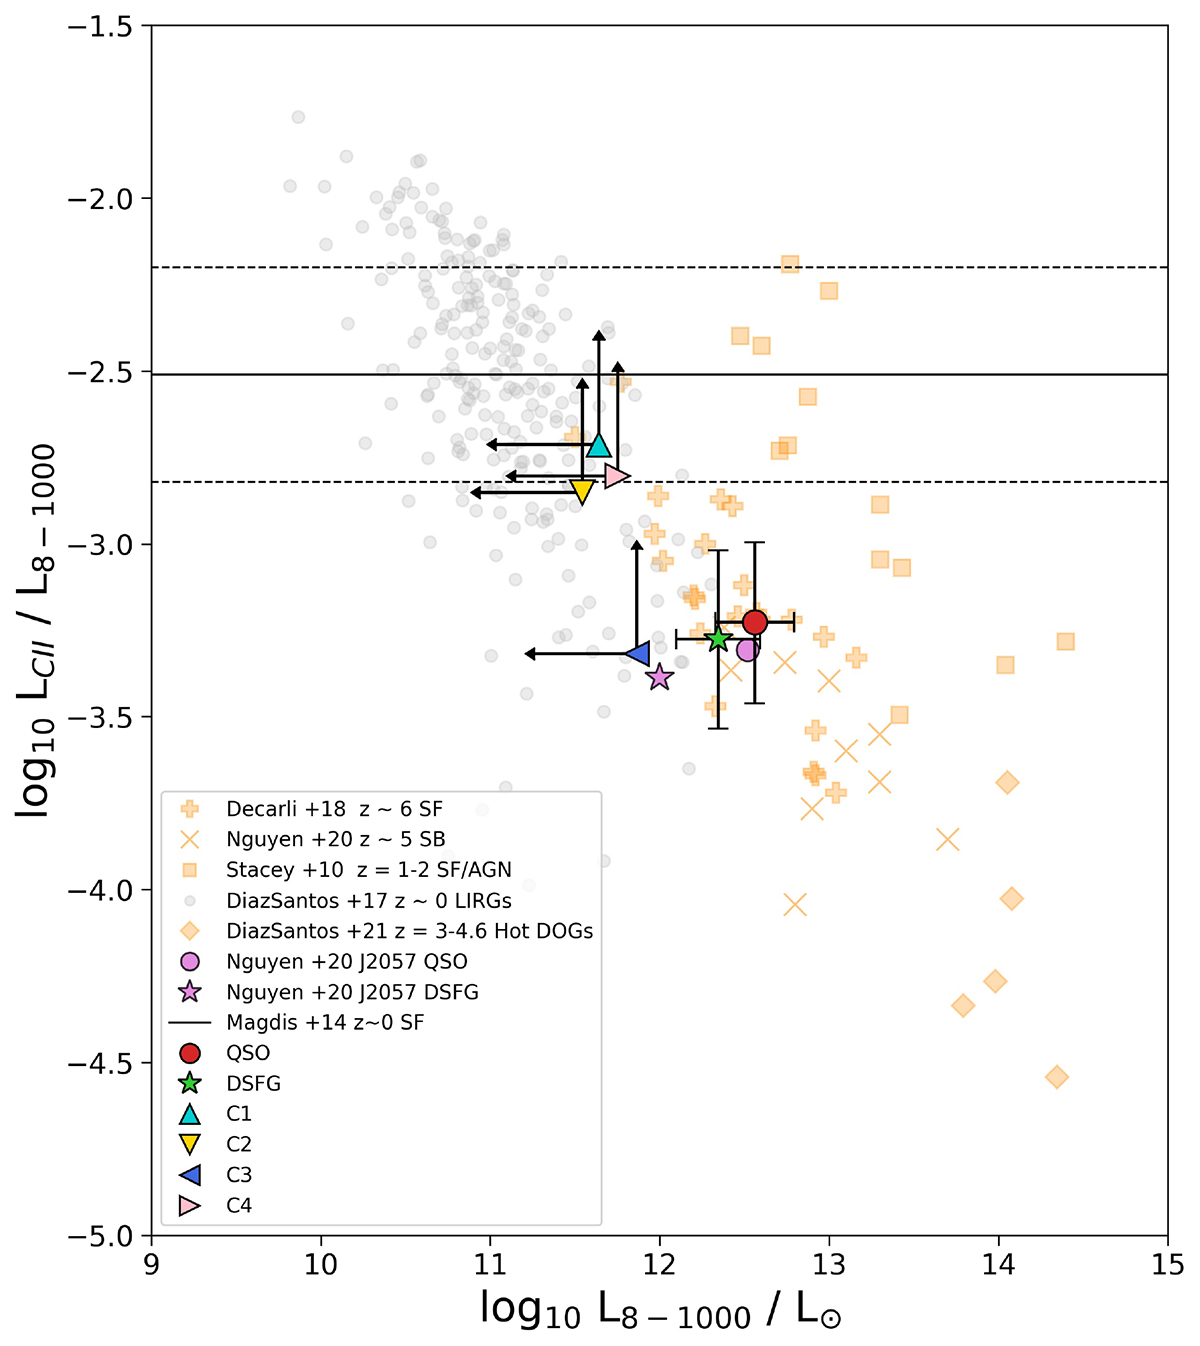
LC II/L8 − 1000 ratio vs. L8 − 1000. The sources are plotted as a red circle for the QSO and a green star for the DSFG. The clumps C1, C2, C3, and C4 are plotted as a cyan triangle-up, a yellow triangle-down, a blue triangle-left, and a pink triangle-right, respectively. The L8 − 1000 are obtained by integrating from 8−1000 μm the SEDs constructed with T = 45 K and β = 1.6. For the clumps, only upper limits of the L8 − 1000 and lower limits for the LC II/L8 − 1000 ratio are shown. The bars represent the quadratic sum of the uncertainties associated with the aperture measurement of the [CII] and FIR emission and the values for L8 − 1000 and LC II/L8 − 1000 obtained using the L8 − 1000 when the SEDs are constructed with T = 40 K and T = 50 K.
Current usage metrics show cumulative count of Article Views (full-text article views including HTML views, PDF and ePub downloads, according to the available data) and Abstracts Views on Vision4Press platform.
Data correspond to usage on the plateform after 2015. The current usage metrics is available 48-96 hours after online publication and is updated daily on week days.
Initial download of the metrics may take a while.