Open Access
Fig. 5.
Download original image
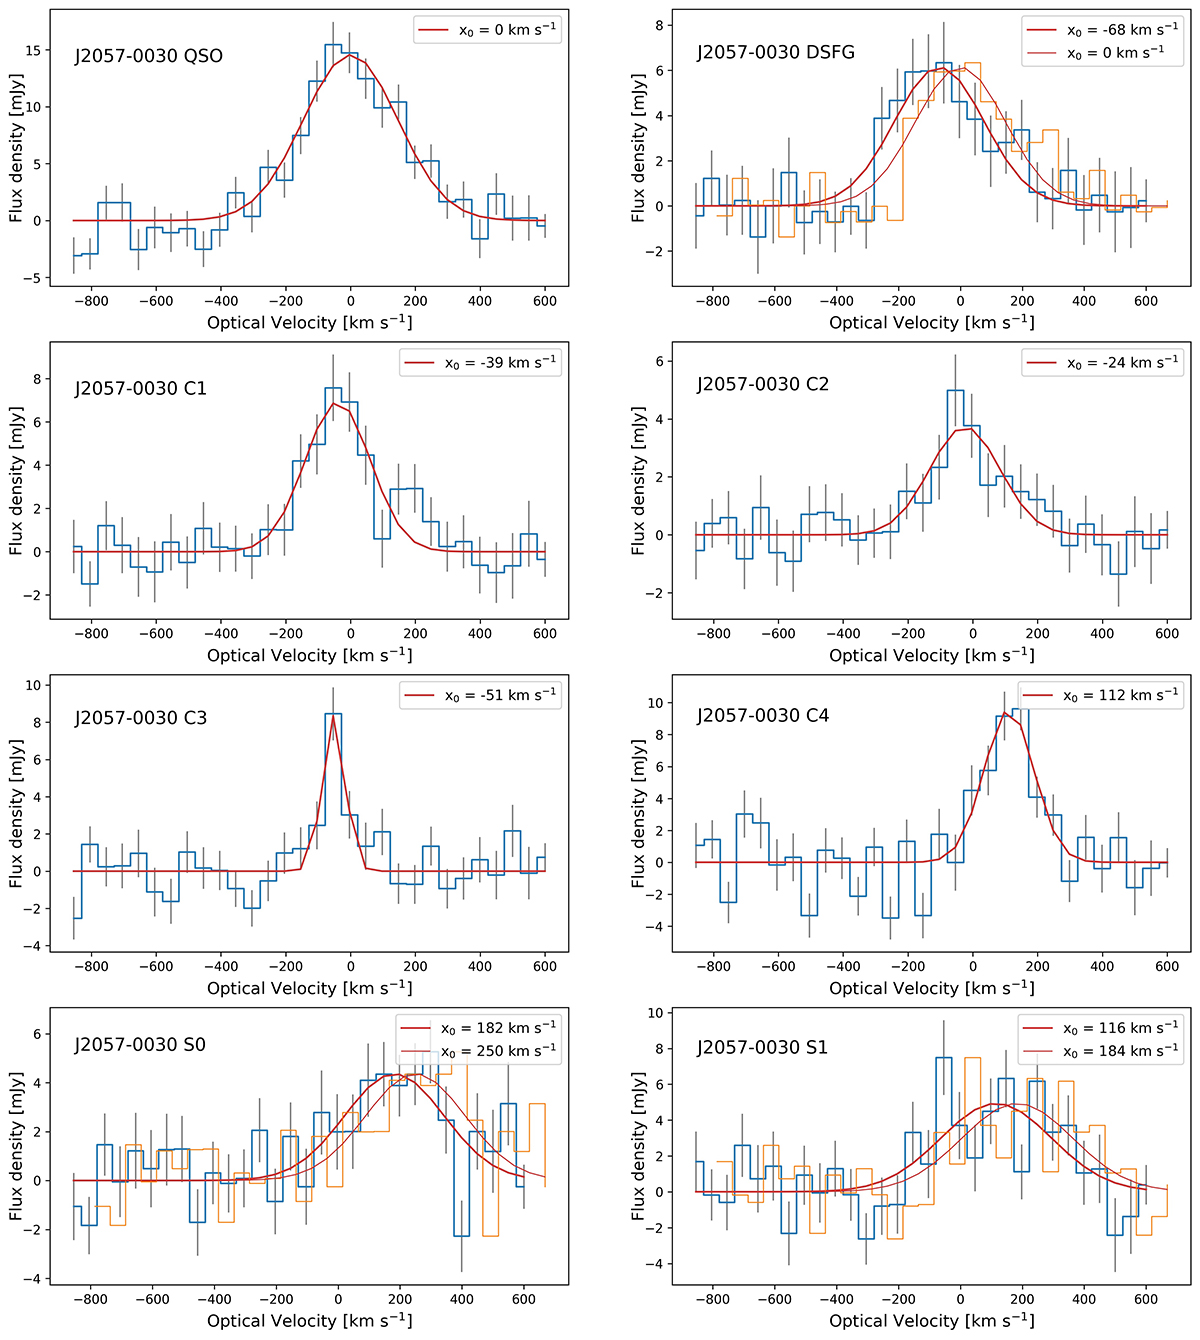
Spectra of the [CII] λ157.74 μm emission line for all the components of the system. A 1D Gaussian fit is shown as a solid red line with its respective center x0 shown in the right corner. The orange line represents the spectra of the sources centered at the x0 of the DSFG. The rms is plotted as gray bars.
Current usage metrics show cumulative count of Article Views (full-text article views including HTML views, PDF and ePub downloads, according to the available data) and Abstracts Views on Vision4Press platform.
Data correspond to usage on the plateform after 2015. The current usage metrics is available 48-96 hours after online publication and is updated daily on week days.
Initial download of the metrics may take a while.