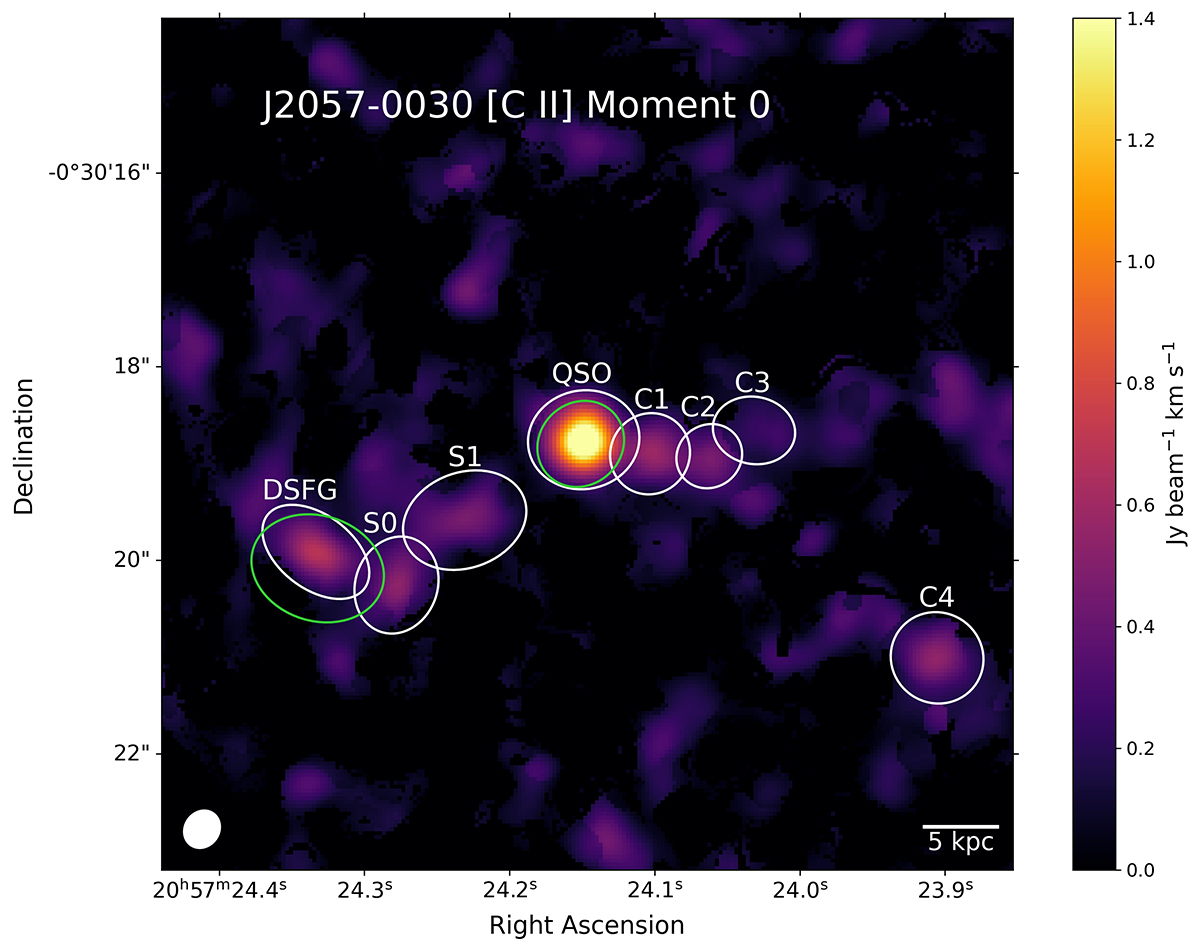
Fig. 4.
Download original image
Apertures used for flux measurements. The map shows the integrated value of the [CII] spectrum (moment 0) for the lower resolution combination. The white ellipses represent: The QSO, the DSFG, and the clumps (C1, C2, C3, C4, S0, and S1). The white apertures are used to extract the [CII] 1D spectra and to measure the continuum of the clumps. The continuum of the QSO and DSFG are estimated using the green ellipses representing the 2D Gaussian fit of the continuum. The synthesized beam is shown in the bottom-left as a white filled ellipse. North is up and east is to the left.
Current usage metrics show cumulative count of Article Views (full-text article views including HTML views, PDF and ePub downloads, according to the available data) and Abstracts Views on Vision4Press platform.
Data correspond to usage on the plateform after 2015. The current usage metrics is available 48-96 hours after online publication and is updated daily on week days.
Initial download of the metrics may take a while.