Fig. 2.
Download original image
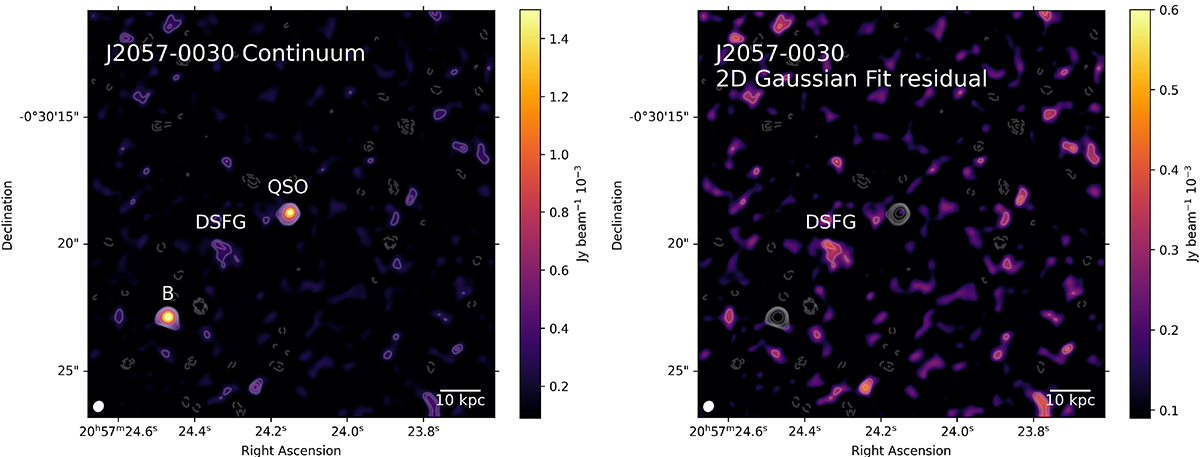
Continuum emission images. Left: the original image. The QSO has significant emission as well as the source “B” which has no [CII] emission and as Nguyen et al. (2020) mentioned it seems to be a source only seen in projection. The DSFG shows faint continuum emission. Right: the QSO and the source “B” have been fitted by a CASA 2D Gaussian and have been subtracted from the original image. Both panels have the contours over-plotted as solid (dashed) white contours indicating the positive (negative) significance levels at [2, 3, 4, 5, 8]σ. The synthesized beam is shown at the bottom-left as a white filled ellipse. North is up and east is to the left.
Current usage metrics show cumulative count of Article Views (full-text article views including HTML views, PDF and ePub downloads, according to the available data) and Abstracts Views on Vision4Press platform.
Data correspond to usage on the plateform after 2015. The current usage metrics is available 48-96 hours after online publication and is updated daily on week days.
Initial download of the metrics may take a while.