Fig. A.1.
Download original image
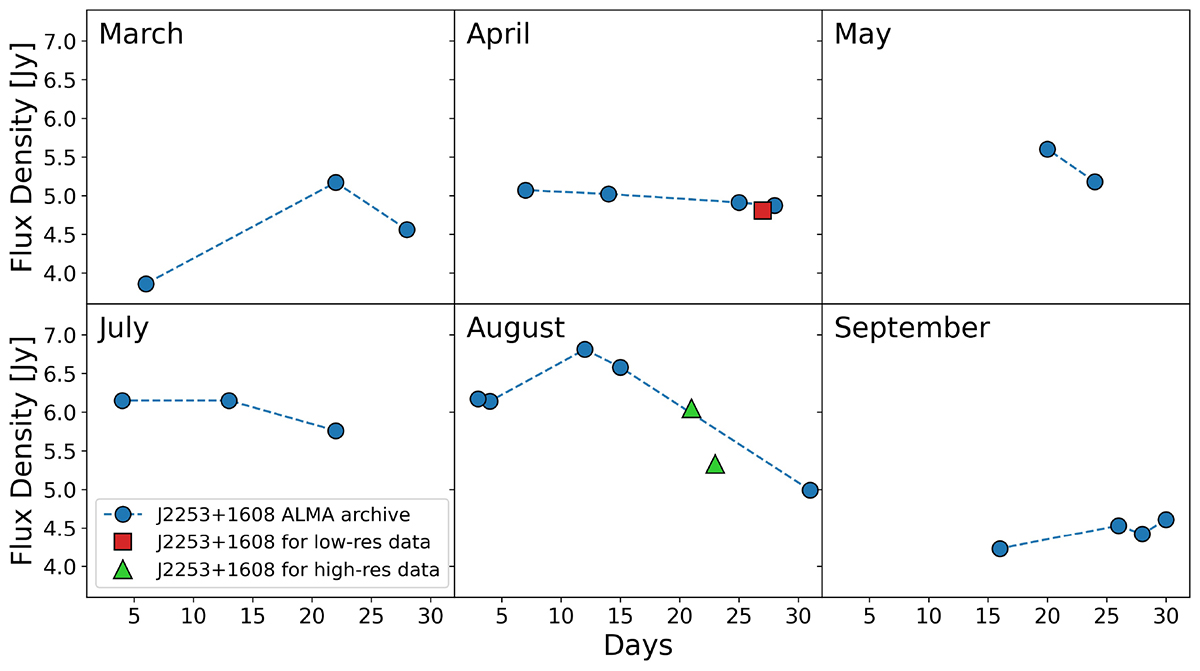
J2253+1608 fluxes from March to May and July to September in 2019 as reported by ALMA. The red square symbolizes the J2253+1608 flux used to calibrate the low resolution data, taken on April 27. The green triangles symbolize the J2253+1608 flux used to calibrate each MS of the high resolution data, taken on August 21 and 23.
Current usage metrics show cumulative count of Article Views (full-text article views including HTML views, PDF and ePub downloads, according to the available data) and Abstracts Views on Vision4Press platform.
Data correspond to usage on the plateform after 2015. The current usage metrics is available 48-96 hours after online publication and is updated daily on week days.
Initial download of the metrics may take a while.