Fig. 10.
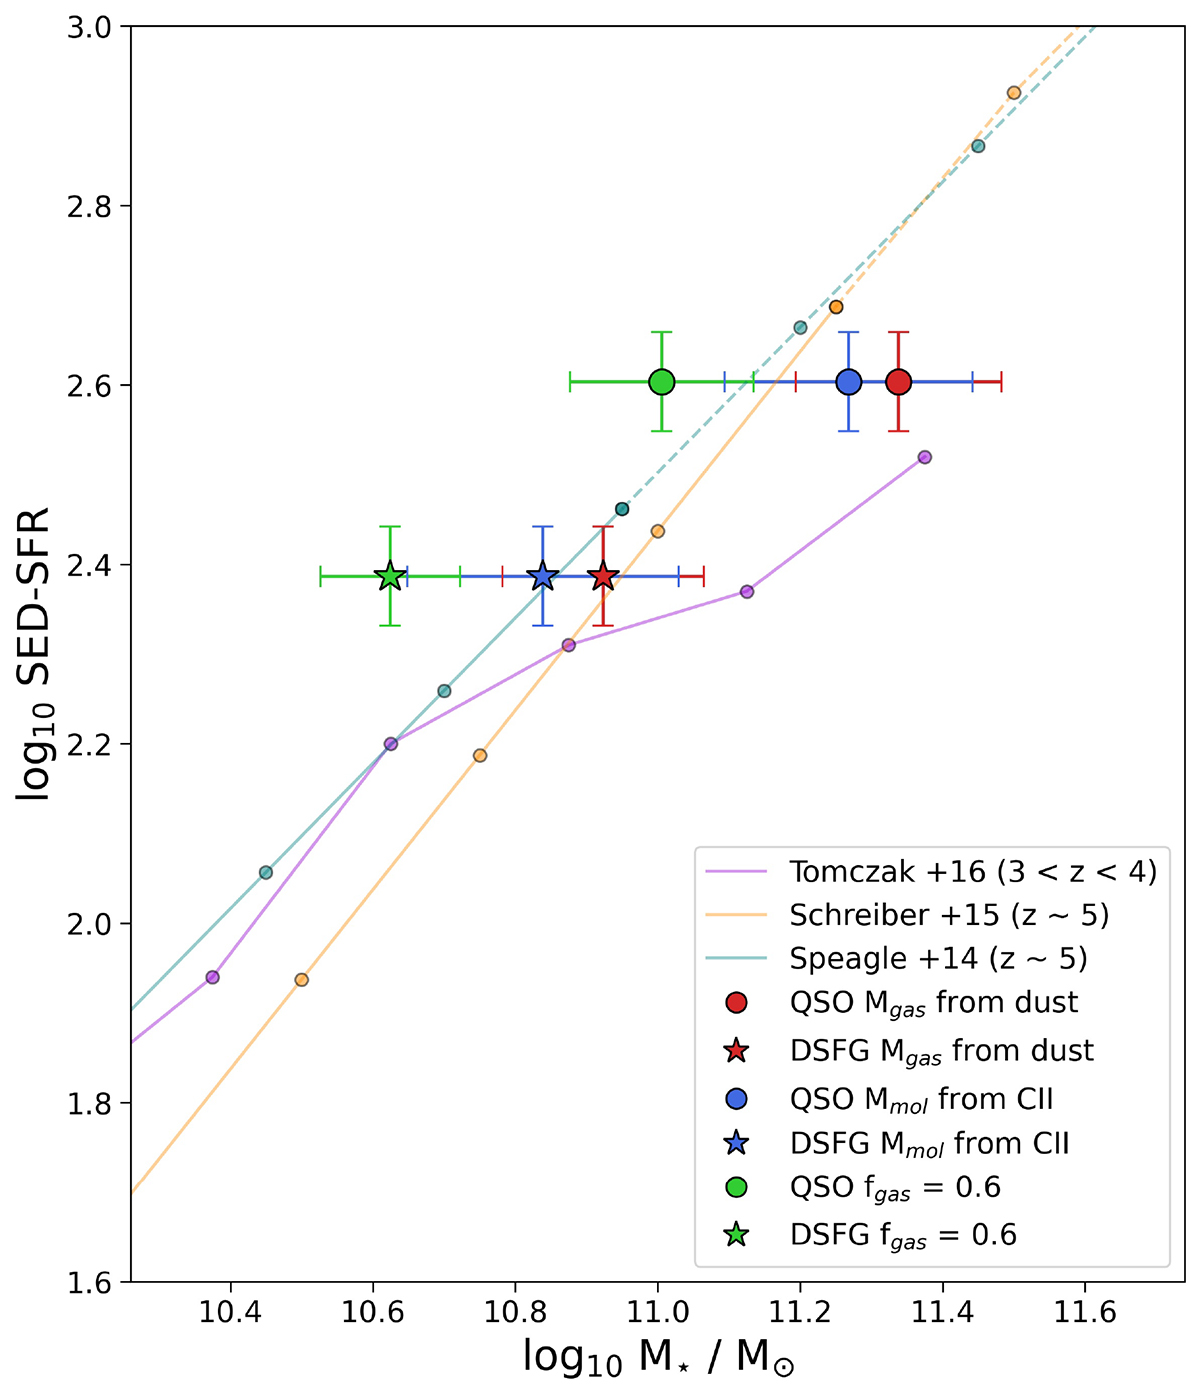
Download original image
Stellar mass vs. star formation rate (main sequence of star-forming galaxies). The filled circle and star represent the QSO host and the DSFG, respectively. We estimate the stellar mass using M⋆ = (1 − fgas) Mdyn with fgas ≡ Mgas/Mdyn. When Mgas is calculated using the dust mass Mdust and a gas-to-dust ratio (GDR = 100) the markers are colored red. When the Mmol comes from Zanella et al. (2018) the markers are blue. For the case M⋆ = 0.4 Mdyn (as done in Nguyen et al. 2020) the markers are green. For comparison, three MS curves for high-z sources are plotted: Speagle et al. (2014), Schreiber et al. (2015) and Tomczak et al. (2016).
Current usage metrics show cumulative count of Article Views (full-text article views including HTML views, PDF and ePub downloads, according to the available data) and Abstracts Views on Vision4Press platform.
Data correspond to usage on the plateform after 2015. The current usage metrics is available 48-96 hours after online publication and is updated daily on week days.
Initial download of the metrics may take a while.