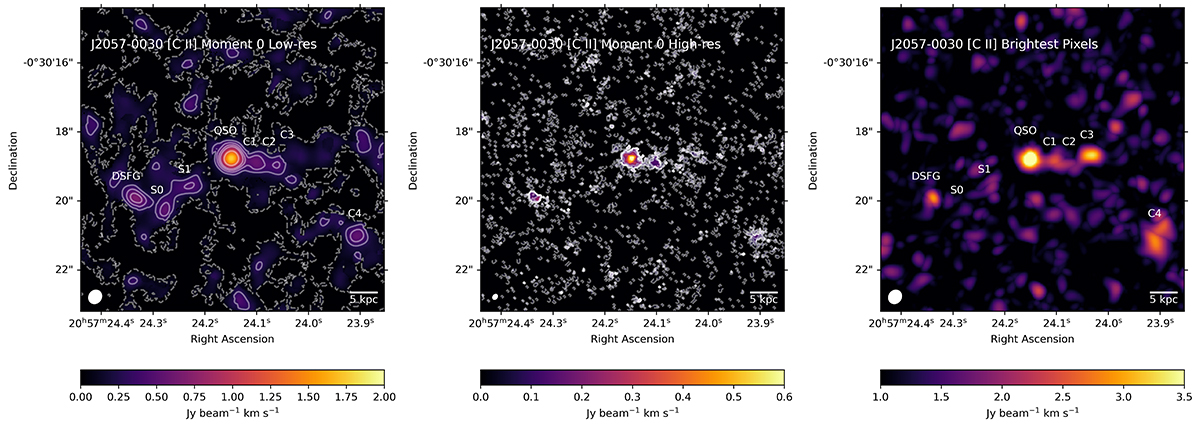
Fig. 1.
Download original image
Components of the system are presented: the QSO, the DSFG, and the clumps (C1, C2, C3, C4, S0, and S1). Left: the map is showing the integrated value of the [CII] spectrum (moment 0) for the lower resolution combination. The beam size is 0.41″ × 0.36″ at PA = −35.69°. Solid (dashed) white contours indicate the positive (negative) significance levels at [2, 3, 4, 5, 8]σ. Middle: moment 0 for the higher resolution combination. The beam size is 0.16″ × 0.12″ at PA = −35.69°. White solid (dashed) contours indicate the positive (negative) significance levels at [2, 3, 4, 5, 8]σ. Right: the map is showing the brightest spaxel value of the [C II] spectrum for the lower resolution combination. C3 is only noticeable in one channel as it has a narrow FWHM ∼ 82 km s−1. For all the panels, the synthesized beam is shown in the bottom-left corner as a white filled ellipse. North is up and east is to the left.
Current usage metrics show cumulative count of Article Views (full-text article views including HTML views, PDF and ePub downloads, according to the available data) and Abstracts Views on Vision4Press platform.
Data correspond to usage on the plateform after 2015. The current usage metrics is available 48-96 hours after online publication and is updated daily on week days.
Initial download of the metrics may take a while.